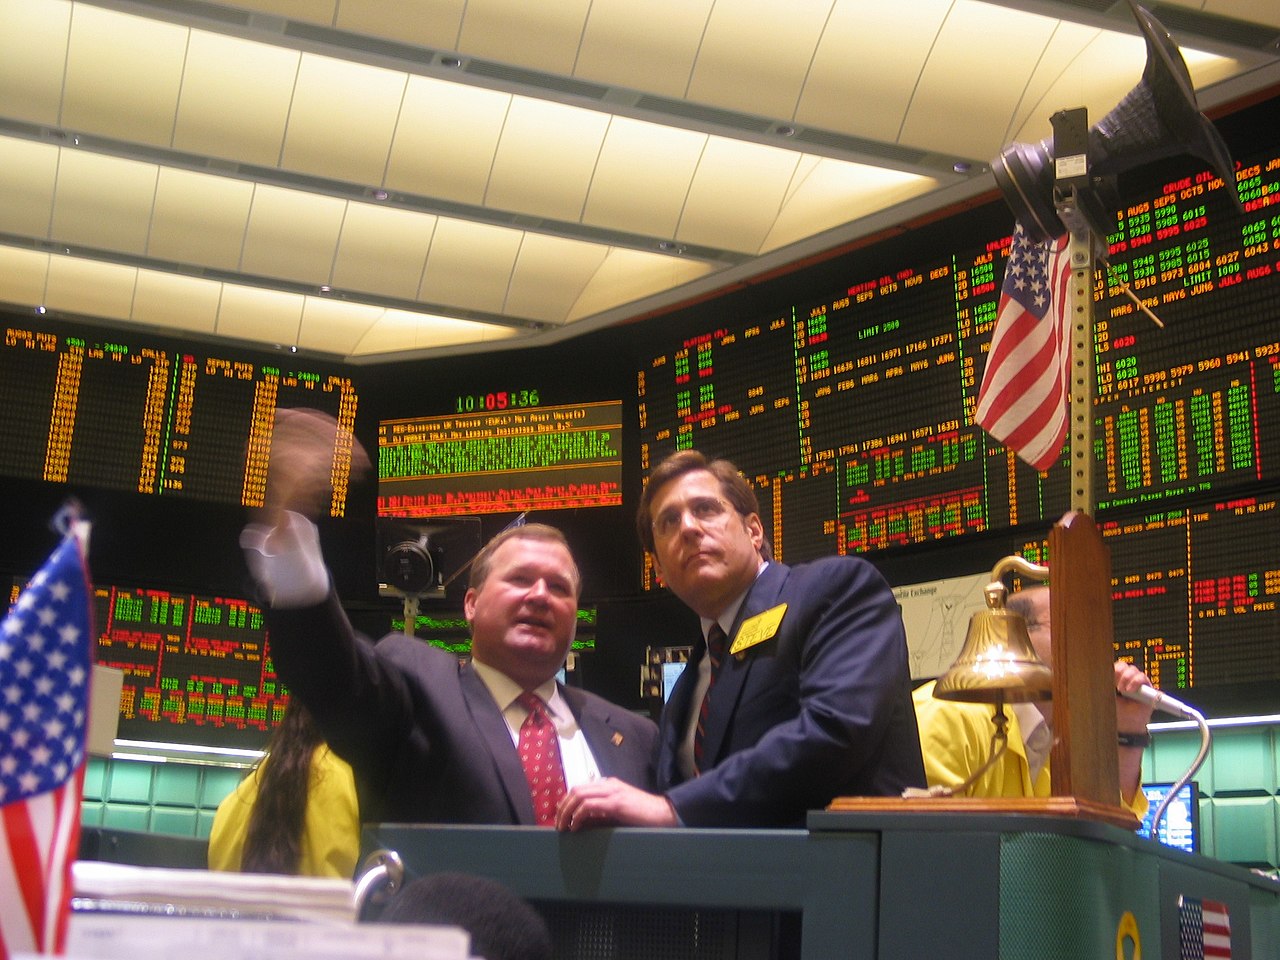
Natural gas trading is where energy traders go to find volatility. Crude oil grinds through 2% days; gas routinely moves 5% on a Thursday morning storage print and has doubled inside six weeks more than once this decade. The first half of 2026 made the point again: front-month Henry Hub futures printed $7.72/MMBtu during the January cold snap, then collapsed to $2.88 by late March as heating demand evaporated. Same commodity, same pipes, 63% price swing in one quarter.
That volatility is the opportunity and the trap. This pillar guide covers how the US gas market actually works — the contracts, the storage cycle, the weather models, the LNG pull — and how traders get paid (or carried out) at each stage. If you trade crude already, keep our complete guide to crude oil trading open in another tab; the two markets rhyme, but the differences are exactly where new gas traders lose money.
The US Natural Gas Market at a Glance
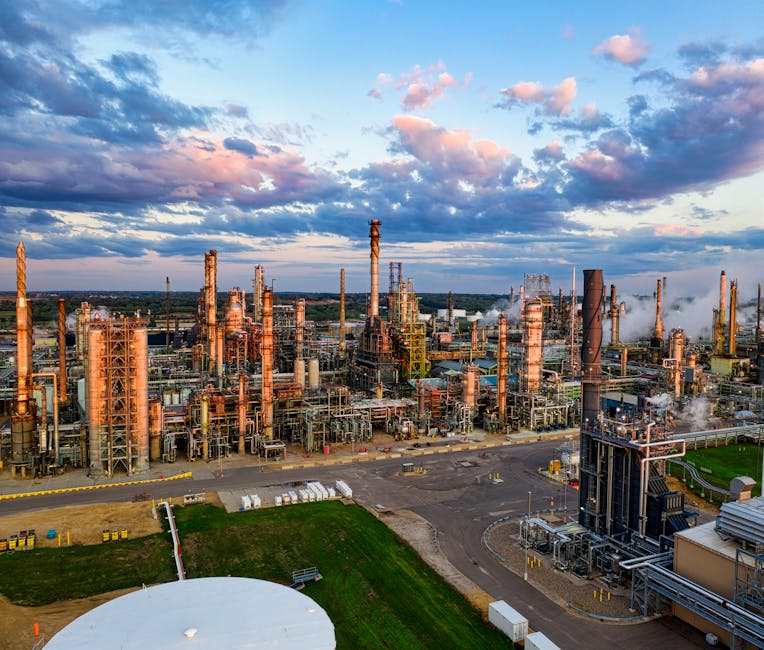
Natural gas is mostly methane, produced today almost entirely from shale. The US pumps roughly 105 dry Bcf/d — the largest output of any country — and since 2017 has been a net exporter. Unlike crude, which prices off global waterborne benchmarks, gas is a regional market shackled to pipeline capacity. Gas in Tokyo can trade at $12/MMBtu while gas in Louisiana trades at $3.50, and no trade you can put on from a retail account closes that gap, because moving the molecule requires a liquefaction plant, a tanker, and a regas terminal.
The North American reference price is Henry Hub, a pipeline junction in Erath, Louisiana, and the delivery point for NYMEX natural gas futures. Every physical gas deal on the continent is quoted as Henry Hub plus or minus a location differential (“basis”). If you learn nothing else before your first trade, learn how Henry Hub pricing works — it is the spine of the entire market.
Where prices sit in mid-2026
After the winter fireworks, Henry Hub spent the spring shoulder season in the low-$3s. The recent range tells you the market’s personality:
- January 2026 peak: $7.72/MMBtu (arctic outbreak, storage draws well above the five-year average)
- Late-March trough: $2.88/MMBtu (mild spring, injections starting early)
- Longer-run band: roughly $2.00–$8.00 outside of genuine crises
Sub-$3 gas is near the pain threshold for dry-gas producers; sustained prices down there eventually cut drilling, which sets up the next rally. That boom-bust reflexivity is the fundamental rhythm of this market.
The Contracts: NG, QG, and Micro Futures
The workhorse instrument is the NYMEX Henry Hub futures contract, listed by CME Group. Three sizes exist, and choosing the right one for your account matters more in gas than in almost any other market because the volatility punishes oversizing so quickly.
Full-size NG
Symbol NG, 10,000 MMBtu per contract. The minimum tick is $0.001/MMBtu, worth $10. A one-cent move is $100; a 30-cent day — routine in winter — swings $3,000 per contract. At $3.50 gas, one contract controls $35,000 of notional against initial margin around $4,000, leverage of roughly 8:1 before you have made a single decision. NG is deeply liquid: daily volume typically runs in the hundreds of thousands of contracts, and the front two months carry the bulk of it. It settles by physical delivery at Henry Hub, which as a speculator you avoid by exiting or rolling before expiry — three business days before the first calendar day of the delivery month.
E-mini QG
Symbol QG, 2,500 MMBtu — a quarter of the full contract. Note the tick: $0.005/MMBtu, worth $12.50, coarser than NG’s. QG is financially settled against the NG final settlement price, so there is no delivery risk, but volume is thin and spreads are wider than the headline size advantage suggests. Honestly, since micros launched, QG has become the awkward middle child.
Micro MNG
Symbol MNG, 1,000 MMBtu — one-tenth of NG, tick $0.001 worth $1.00. Also financially settled against NG. Margin runs a few hundred dollars. This is the right instrument for anyone learning the market: a bad storage-report trade costs you $50 instead of $500, and the tuition lessons are identical. Full specs, margin tables, expiration mechanics and settlement details for all three are in our guide to natural gas futures contract specifications, and the order-entry workflow is covered step by step in how to trade natural gas futures.
Margins are not static. CME raises them when volatility spikes — precisely when losing positions need the cash most. Check current requirements on the CME Group natural gas page rather than trusting any published number, including this one.
A Short History: How Natural Gas Trading Got Here
Context makes the market’s quirks legible. Until the late 1980s, US gas prices were federally regulated and there was nothing to trade. The Natural Gas Policy Act of 1978 began phased decontrol, and FERC Order 636 (1992) finished the job by forcing pipelines to unbundle transportation from gas sales — creating, almost overnight, a physical spot market that needed a hedging venue.
NYMEX obliged in April 1990, launching the Henry Hub futures contract. Volume grew through the 1990s, exploded in the 2000s, and produced the market’s first great cautionary tales: Enron’s gas trading empire collapsed in 2001, and in 2006 the hedge fund Amaranth Advisors lost roughly $6 billion in a matter of weeks on leveraged natural gas calendar spreads — still one of the largest commodity trading losses ever recorded. Every gas trader should read the Amaranth post-mortems. The lesson is not that spreads are dangerous; it is that size kills, and that March/April gas spreads (the famous “widowmaker”) can stay irrational far longer than a levered book can stay solvent.
Then the shale revolution rewrote the supply side. Hydraulic fracturing took US production from about 50 Bcf/d in 2005 to over 100 Bcf/d today, crushed the old $6–$14 price regime of the late 2000s, and turned the US into the world’s largest LNG exporter. Winter Storm Uri in February 2021 supplied the modern risk lesson: while Henry Hub futures merely spiked, physical spot gas at some mid-continent hubs printed in the hundreds of dollars per MMBtu as wells froze. Basis risk is not a footnote in this market.
What Makes Natural Gas Trading Different from Crude
Regional pricing, not global
Brent and WTI move together within a few dollars; a missile strike in the Gulf reprices oil everywhere at once. Gas does not work that way. US, European (TTF), and Asian (JKM) benchmarks can decouple violently — TTF traded above $90/MMBtu in the 2022 European crisis while Henry Hub sat near $8. LNG arbitrage links the regions loosely, but liquefaction costs of $2–3/MMBtu plus shipping keep the linkage elastic. Trade the region you can actually analyze.
Weather is the demand curve
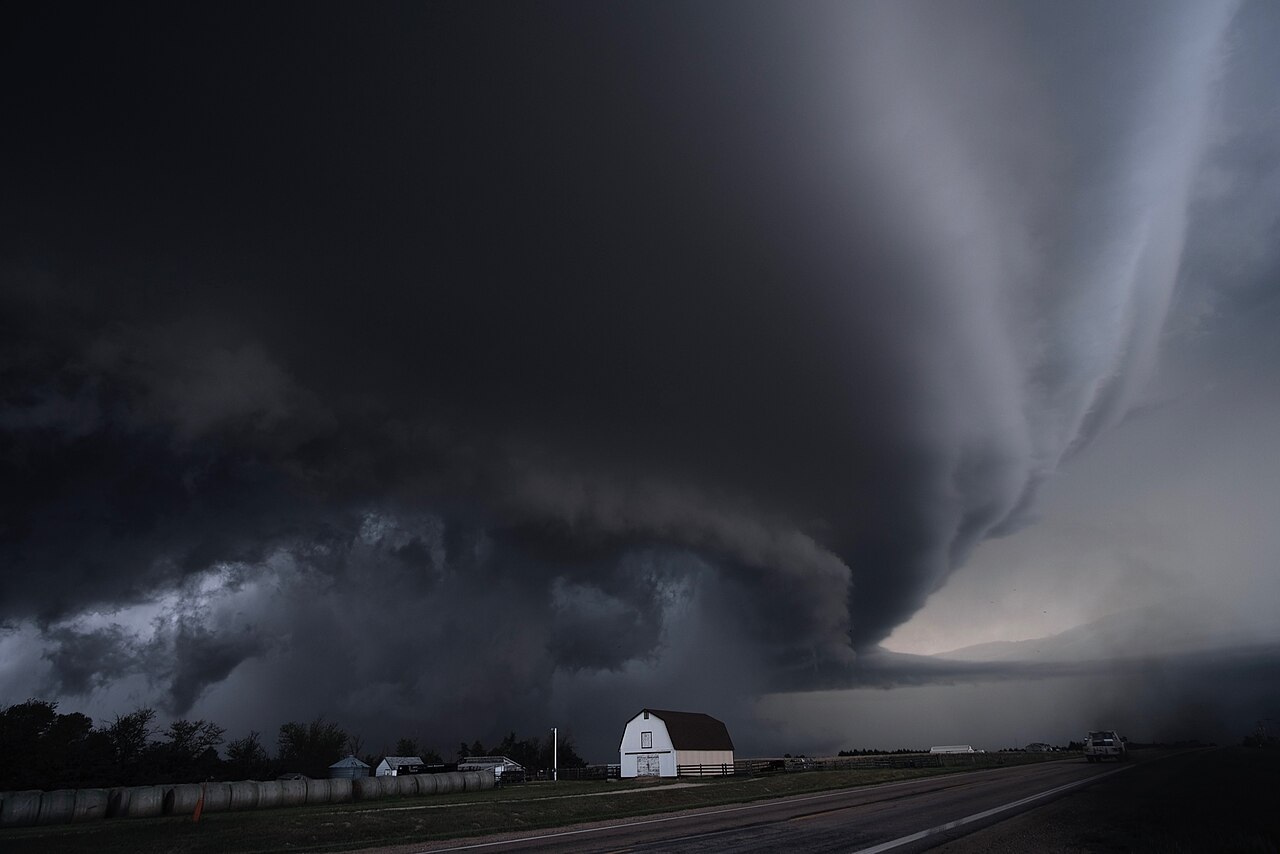
Crude demand barely notices a cold week. Gas demand can swing 25% or more on one. Roughly half of US homes heat with gas or electricity generated from it, storage is finite, and pipes are capacity-constrained — so price has to do the rationing work immediately. There is an entire professional class of weather traders who care about nothing but forecast revisions, and on a two-week horizon they are usually the marginal price-setter.
Volatility is seasonal, and it is not subtle
Winter implied volatility routinely runs around twice summer levels — think annualized vol near 100% in January versus 50% in July. A position size that feels conservative in August is reckless in January. Professionals resize seasonally as a matter of routine; retail traders usually learn this by donation.
The Storage Cycle: The Market’s Heartbeat
Gas produced in June gets consumed in January via underground storage — depleted reservoirs, aquifers, and salt caverns. The cycle is brutally regular:
- Injection season (April–October): production exceeds demand; the surplus flows into storage, building from roughly 1,200 Bcf after a normal winter toward a seasonal peak around 3,800–3,900 Bcf by early November.
- Withdrawal season (November–March): heating demand outruns production and inventories drain back down. A brutal winter can pull stocks low enough to price genuine scarcity.
Traders obsess less over absolute inventory than over the deviation from the five-year average. A 200 Bcf deficit heading into December is a bull story; a 300 Bcf surplus in June smothers rallies all summer. The forward curve reflects the cycle too: during injection season the strip typically sits in contango (deferred winter months priced above spot, paying the market to store gas), and cold-season scarcity flips the front into backwardation. Calendar-spread traders live entirely inside these relationships — long March/short April is the classic scarcity bet, and the classic account-killer.
The Thursday EIA storage report
Every Thursday at 10:30 a.m. ET the EIA publishes the Weekly Natural Gas Storage Report — the net injection or withdrawal versus consensus. Prices can jump 10–20 cents in seconds on a surprise. Here is the desk-honest take: most retail traders lose money trading the release. You are competing with algos that parse the number in microseconds, the first move frequently reverses within half an hour, and slippage through the print is vicious. If you must be involved, trade the post-report trend once the dust settles, or trade your view beforehand in micro size. Holding a full-size levered position through the print is not a strategy; it is a coin flip with a rake.
Weather: Reading the Real Demand Forecast
Short-term gas trading is applied meteorology. The tools of the trade:
- Model runs: the American (GFS) and European (ECMWF) weather models update multiple times daily. Overnight shifts in the 6–15 day temperature outlook move the market at the Sunday reopen more reliably than any other input.
- HDDs and CDDs: heating and cooling degree days convert temperatures into demand estimates. Population-weighted HDDs are the single best one-number proxy for winter demand.
- Forecast revisions, not levels: the market has already priced the current forecast. Money is made on the change — a colder shift in the European model’s day-10 map is a trade; “it’s cold in January” is not.
A genuinely cold pattern flip can rally the front month 30–50% in weeks; a warm December can smother the entire winter premium by New Year’s. This is also why winter futures carry a persistent risk premium through summer and autumn — sellers of that premium collect most years and get destroyed occasionally, which is exactly what a risk premium means.
LNG Exports: The New Demand Anchor
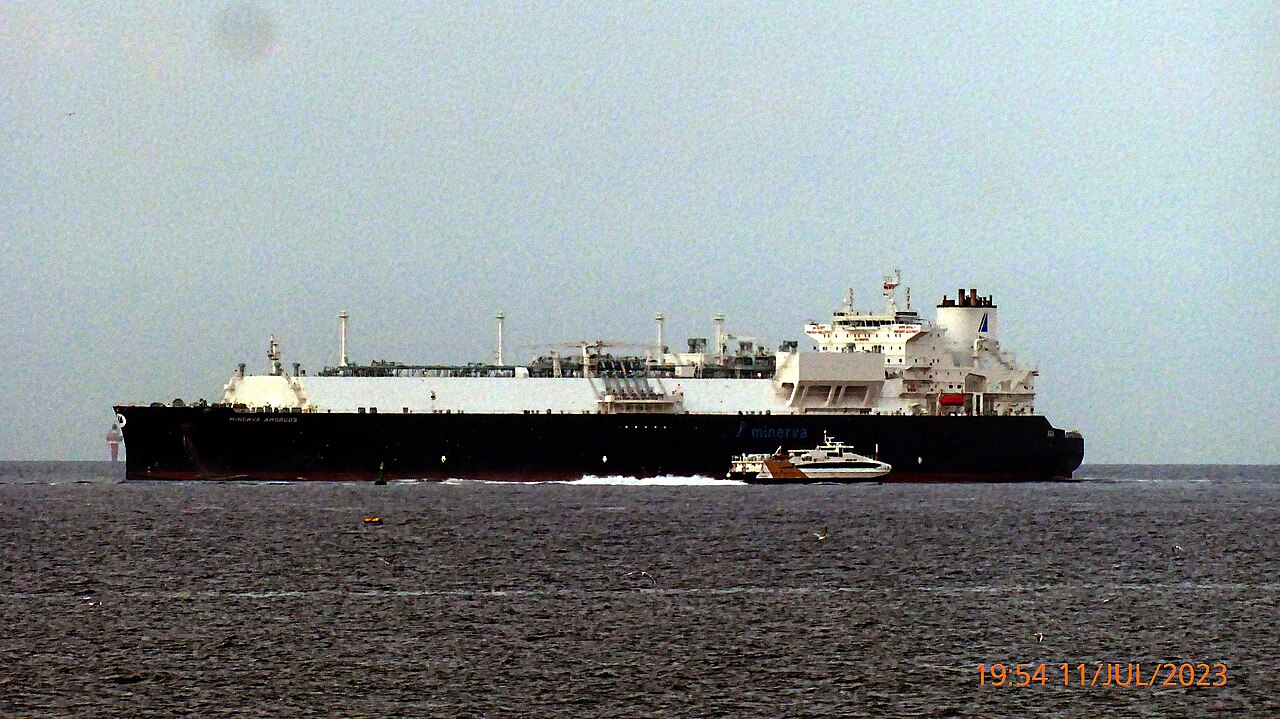
The single biggest structural change of the past decade is liquefied natural gas. Sabine Pass shipped the first lower-48 LNG cargo in February 2016; a decade later, feedgas demand at US export terminals — Sabine Pass, Corpus Christi, Freeport, Cameron, Cove Point, Calcasieu Pass, Plaquemines and the ramping Golden Pass — runs near 20 Bcf/d, roughly a fifth of US production. That is demand that did not exist ten years ago, and it is the main reason sub-$2 gas no longer sticks.
For traders, LNG cuts both ways:
- When TTF or JKM trades far above Henry Hub, terminals run flat-out and US gas has a firm bid under it.
- When an export facility trips offline, its feedgas backs up into the domestic market instantly. The Freeport LNG explosion in June 2022 knocked out about 2 Bcf/d and Henry Hub sold off hard while European prices rallied — the same outage, opposite trades on opposite sides of the Atlantic.
Watch daily feedgas nominations and the Henry Hub–TTF and Henry Hub–JKM spreads. (JKM — the Japan-Korea Marker — is the Asian spot LNG benchmark; don’t confuse it with JCC, the older oil-linked contract index.) When those spreads compress toward liquefaction cost, export economics get shaky and the domestic bid softens.
Supply: Where the Gas Comes From
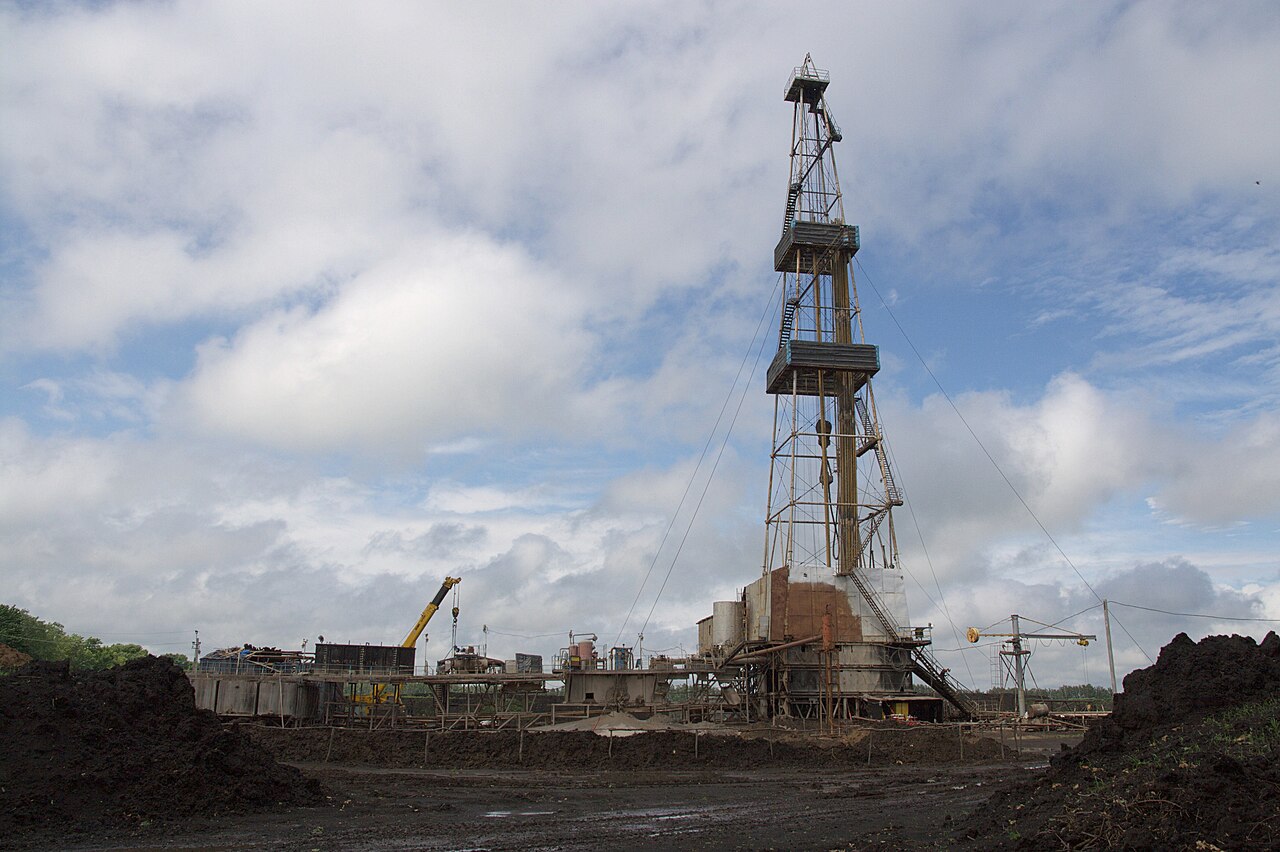
Three basins dominate, and their economics differ in ways that matter for price:
- Appalachia (Marcellus/Utica): the giant, producing in the mid-30s Bcf/d across Pennsylvania, West Virginia and Ohio. Low-cost, but pipeline-constrained — local Appalachian prices frequently trade well under Henry Hub because the gas struggles to leave the region.
- Permian Basin: associated gas, a byproduct of oil drilling. These producers respond to WTI, not to gas prices, which is why Permian gas keeps flowing even when it is nearly worthless — the local Waha hub has traded below zero in oversupplied stretches. If you trade gas, you still need a view on oil; our primer on natural gas supply and demand fundamentals works through this linkage in detail.
- Haynesville: the swing producer. Dry gas, deeper and costlier wells, but sitting on top of the Gulf Coast LNG corridor. Haynesville rigs are the fastest supply response when prices push above roughly $4; watch its rig count as a leading indicator of the supply side.
Round out the map with the Gulf of Mexico (1–2 Bcf/d, hurricane-exposed), the Rockies, and Oklahoma’s legacy fields. Hurricane risk, incidentally, has inverted since the shale era: Gulf storms once meant lost supply and rallies; now they more often mean lost LNG exports and power demand — a bearish event. Traders running the 2005-era playbook get this exactly backwards.
Demand: Who Burns It
Demand splits roughly four ways, and each sector has its own price behavior:
- Power generation (~40%): the growth engine and the volatility engine. Gas plants balance the grid around wind and solar, so calm, cloudy, hot weeks pull hard on gas. Coal-to-gas switching also makes power demand price-elastic — cheap gas gets burned more, which is a self-correcting mechanism traders can lean on.
- Industrial (~30%): fuel and feedstock for chemicals, fertilizer, steel. Steady, economically sensitive, slow-moving.
- Residential and commercial (~25% combined): almost pure weather. Winter mornings set the peaks.
- LNG feedgas: covered above — the marginal demand source that connects everything.
Technical Analysis That Actually Helps in Gas
Gas is a fundamentally driven market, but technicals earn their keep for timing and risk placement. What works, in practice:
- Seasonal turning windows. The market habitually puts in significant lows in late winter/early spring (February–April) as withdrawal season ends, and often marks local highs in the autumn as the winter premium peaks before reality arrives. These are tendencies, not laws — but fading a fresh low in March with defined risk has a better base rate than doing the same in November.
- ATR-based sizing. Average True Range might read 10–15 cents in July and 40+ cents in January. Divide your fixed dollar risk by current ATR to size positions and your winter drawdowns shrink dramatically. This one habit is worth more than any indicator.
- Volume context. Shoulder-season chop on thin volume is noise; moves on storage-report or model-run volume have follow-through. Respect the difference.
- Prior settlement and round numbers. Gas respects whole and half-dollar levels ($3.00, $3.50) to an almost embarrassing degree. Options strike gravity is real around expiry.
What does not work: importing an equity-index day-trading system untouched. Gas gaps, it trends violently, and it reverses on a forecast revision at 4 a.m. Build the fundamentals into the process or the chart will lie to you at the worst moment.
Basis Trading: The Second Market Hiding Behind Henry Hub
Futures traders watch one price. Physical traders watch dozens, because every regional hub trades at its own level, quoted as a differential to Henry Hub. That differential — basis — is where pipeline reality shows up in price, and even a pure futures trader needs to read it, because basis blowouts are the early warning system for benchmark moves.
The recurring patterns are worth memorizing:
- Appalachia trades weak. Too much supply chasing too little takeaway capacity keeps Marcellus-area prices persistently below Henry Hub, often by $0.50 or more. When a new pipeline opens, the discount narrows; when one goes down for maintenance, it gapes.
- Waha (West Texas) trades weakest of all. Permian associated gas has nowhere to go when pipelines fill, and Waha has printed negative absolute prices in oversupplied stretches — producers literally paying to have gas taken away. Negative Waha while Henry Hub sits at $3 is not a data error; it is a pipeline map expressed in dollars.
- New England citygates spike hardest. Algonquin and other Northeast delivery points can trade at $10, $20, even $30/MMBtu during deep cold because pipeline capacity into the region is capped and LNG cargoes must fill the gap at world prices. Same continent, tenfold price difference.
- Gulf Coast trades tight to the Hub. Proximity to Henry Hub and to LNG terminals keeps Texas–Louisiana coastal points near benchmark.
Winter Storm Uri was the extreme case: futures traders saw a spike; physical traders at unhedged mid-continent utilities saw week-long spot prices in the hundreds of dollars and, in some cases, bankruptcy. If you graduate into calendar spreads or basis products, understand that you have left the deep liquidity of the front-month NG book and entered a market where the exit door is narrower.
Beyond Futures: Options, ETFs, and Gas Equities
Options on NG futures
Options fit this market unusually well because gas volatility is lumpy and event-driven. Practical uses:
- Defined-risk directional bets. A long call into winter caps your loss at premium paid — no margin call, no gap-through-stop. You pay for that certainty; winter options are never cheap.
- Event structures. Straddles or strangles over a storage report or a model-flip window profit from movement without picking direction. The market prices these events, so the edge is in expecting a bigger surprise than consensus does — not in the structure itself.
- Premium selling — carefully. Selling upside calls in gas has bankrupted funds. The upside tail in this market is enormous (winter gas can triple), so naked short calls are the single worst risk/reward habit available to a retail gas trader. Sell spreads or don’t sell.
ETFs and ETNs
UNG holds front-month futures and rolls them monthly, so in a contango market it sells low and buys high twelve times a year — a structural bleed that has ground its long-term chart to dust even while spot gas went sideways. BOIL and KOLD add daily-rebalance decay on top. Fine for a one-week tactical view in a stock account; wealth-destroying as buy-and-hold. This is not a criticism of the products, it is what the prospectus says they do.
Producer and infrastructure equities
Dry-gas producers like EQT and Antero are levered plays on the gas strip with corporate risk attached; Cheniere is effectively a toll road on LNG export volumes; pipeline operators earn fees largely insulated from price. Equities respond to the 12–24 month strip more than to the front month, so they suit investors with fundamental views and longer horizons — a different game from trading the Thursday number.
Three Worked Trades
1. The storage-surprise fade (event trade)
Setup: consensus expects a 75 Bcf injection; the EIA prints 90 Bcf — bearish surprise. Front-month NG drops 12 cents in two minutes, from $3.42 to $3.30. History says the knee-jerk overreacts more often than not when the surprise is modest and the weather backdrop hasn’t changed. The trade: wait for the first five-minute range to complete, buy micros at $3.31 with a stop under the post-report low at $3.27, target half the gap at $3.36. Risk 4 cents ($40 per MNG), target 5 ($50). Note everything defined before entry — and note the honest caveat: when the surprise is huge (30+ Bcf off consensus), do not fade it; big surprises trend.
2. The model-flip momentum trade (weather trade)
Setup: for a week the European model has shown a warm ridge dominating mid-December; overnight, both GFS and ECMWF flip to a cold trough for days 8–14, adding roughly 20 population-weighted HDDs to the outlook. Gas opens up 3% and holds the gap through the first hour. The trade: buy the strength — weather-revision moves persist for days as forecasts confirm and physical buyers chase. Enter on the first shallow pullback, stop under the pre-gap settle, trail as revisions extend. The exit signal is symmetrical: the first model run that takes the cold back out. No loyalty, no thesis-drift; you are long a forecast, nothing more.
3. The injection-season carry lean (positional trade)
Setup: June, storage running 250 Bcf above the five-year average, production strong, no heat in the 15-day outlook. The curve sits in contango. The lean: sell rallies in the front month toward known resistance with defined risk, on the logic that surplus storage caps spikes while carry pressures spot. This is a base-rate trade — it wins modestly and often, and its known failure mode is a July heat dome or a hurricane hitting an LNG terminal (bullish via power burn, remember, not bearish). Size so the failure mode is survivable, take profits into weakness, and stand down once the surplus narrows.
A Gas Trader’s Week
The market has a weekly pulse, and a routine built around it beats talent without one:
- Sunday evening: the reopen prices 48 hours of weather-model drift. Check the weekend runs before the open, not after the gap.
- Monday–Wednesday: model watch morning and evening; track LNG feedgas nominations and any pipeline maintenance notices. Position ahead of Thursday deliberately or not at all.
- Thursday 10:30 a.m. ET: storage report. Event-risk rules apply. The afternoon trend after the dust settles is often cleaner than the print itself.
- Friday: book review. Log every trade against the season, the vol regime, and the event calendar. Cut winter size targets if ATR is expanding faster than your P&L.
How the 2020s Rewrote the Gas Rulebook
Recent history is the best syllabus this market offers, because every regime of the past six years demanded a different playbook:
- 2020 — the glut. COVID crushed demand into an already oversupplied market and front-month gas traded down toward $1.50, the weakest prices in a generation. Producers slashed drilling; the seeds of the next spike were planted at the bottom, as usual.
- 2021 — Uri. February’s freeze took supply and demand hostage simultaneously: wellheads froze while heating load exploded. Futures rallied, but the real violence was physical — spot gas at some mid-continent hubs traded in the hundreds of dollars, and entities that had sold firm supply they didn’t own were ruined in a week.
- 2022 — the global squeeze. Russia’s invasion of Ukraine sent European prices to records, US LNG ran flat-out, and Henry Hub touched its highest levels since 2008 — near $10 in late August — before the Freeport outage and a mild winter broke the fever.
- 2023–2024 — the hangover. Record production met warm winters; the front month spent stretches below $2 and producers curtailed output. Shorting weakness near cycle lows proved to be picking up pennies in front of the recovery.
- 2025–2026 — the LNG era proper. New export trains tightened the balance and the January 2026 cold snap showed how quickly a 100+ Bcf/d market can still gap to $7+. Bigger demand base, same old weather.
The through-line: gas spends most of its time mean-reverting inside a band set by production costs and storage, and a small fraction of its time in violent trends when weather or infrastructure breaks the balance. Strategies must survive the first regime and monetize the second — most retail approaches do the opposite.
Market Mechanics: Hours, Settlement, and the Tape
Housekeeping details that become P&L when ignored:
- Trading hours: CME Globex runs Sunday 6 p.m. ET through Friday 5 p.m. ET, with a one-hour daily pause at 5 p.m. Nearly 24-hour access — but depth outside US hours is a fraction of the regular session, and stop orders resting in the thin overnight book get filled badly.
- Daily settlement: established in the afternoon window around 2:30 p.m. ET. Margins, ETF NAVs, and most P&L reporting key off settlement, and price often firms or fades into that window as bigger players mark positions.
- Expiration: NG stops trading three business days before the first calendar day of the delivery month. Liquidity migrates to the next month a week or more ahead of that; roll early rather than fighting for exits in a dying contract.
- The strip matters. Professionals quote and trade seasonal strips — the winter strip (Nov–Mar) and summer strip (Apr–Oct) — because that is how physical volumes are hedged. When the front month rallies but next winter’s strip doesn’t move, the market is telling you the event is temporary weather, not structural tightness. That divergence is free information; read it before every positional trade.
The Data Stack: What to Watch, in Priority Order
New traders drown in data. Ranked by how often each input is actually the reason price moved today:
- Weather model runs (multiple times daily). The 6–15 day temperature outlook, weighted toward revisions. This is the market’s heartbeat from October through March.
- EIA Weekly Storage Report (Thursday 10:30 a.m. ET). The scoreboard for the supply-demand balance, judged against consensus and the five-year average.
- LNG feedgas nominations (daily). A terminal running 1.5 Bcf/d light is a demand story worth cents; a terminal down for months is worth dimes.
- Production estimates (daily pipeline-flow models). Freeze-offs in winter and grid maintenance in summer show up here first, before any official statistic.
- Rig counts and producer guidance (weekly/quarterly). Slow variables that set the 6–18 month balance. They rarely move today’s tape but they decide next year’s range.
- CFTC Commitments of Traders (Friday). Extreme managed-money positioning marks crowded trades; record shorts near cycle lows have preceded several of the nastiest squeezes.
Everything on that list except commercial weather services is free, mostly from the EIA’s natural gas portal. The retail edge in gas is not secret data; it is doing the boring synthesis every single day and sizing honestly when the picture is unclear.
One more habit separates professionals from tourists: write down, before each week begins, what would change your mind. “I am short because storage is 250 Bcf over the five-year average; I cover if the day-8–14 outlook adds 15 HDDs or Freeport trips offline.” A thesis with tripwires survives contact with this market. A vibe does not — and gas is ruthless with vibes.
Case Study: The Widowmaker and Why Spreads Deserve Respect
The March/April futures spread — last month of withdrawal season against first month of injection season — is nicknamed the widowmaker for a reason. In a scary winter, March gas prices scarcity while April prices the spring reset, so the spread can explode from a few cents to several dollars. In a mild winter it dies quietly toward zero. Amaranth’s 2006 collapse was, at its core, a massively levered bet on exactly these seasonal spreads; when the market moved against the fund, the position was too big to exit and roughly $6 billion evaporated. The 2018 vol spike ended the short-vol fund OptionSellers the same way, on the other side of the market.
Two durable lessons. First, spreads are not intrinsically safer than outrights — margin offsets tempt traders into sizes they would never run flat-price. Second, liquidity in gas is conditional: it is everywhere until you need it. Size every position as if you might have to exit on the worst day of the year, because occasionally you will.
Risk Management: The Non-Negotiables
- Risk a fixed fraction, resize for season. 1% of account per trade is a sane ceiling. Convert it to contracts via current ATR, not via what worked in July.
- Assume gaps. Gas trades nearly 24 hours but closes daily from 5–6 p.m. ET and over the weekend — and weather models do not pause. Sunday-night gaps through stops are a fact of life; either carry smaller weekend positions or hedge with options.
- Treat storage Thursdays as scheduled event risk. Flatten, downsize, or accept binary outcomes knowingly — never accidentally.
- Beware the leveraged ETF trap. Products like UNG bleed on contango roll; 2x and 3x gas ETFs decay from daily rebalancing on top of that. They are trading vehicles for days, not investments for months. If your horizon is longer than a couple of weeks, futures or options on futures are the honest instruments.
- Margin is dynamic. Exchanges hike margins mid-crisis. Keep enough free cash that a 50% margin increase is an annoyance, not a forced liquidation.
Common Natural Gas Trading Mistakes
- Carrying summer size into winter. Volatility roughly doubles; halve your size or the market halves your account.
- Trading the forecast level instead of the revision. Cold that is already on the map is already in the price.
- Holding through the storage print out of hope. Hope is not a hedge.
- Fighting seasonality. Structural shorts into November and structural longs into April start with a headwind.
- Ignoring basis. Henry Hub is the benchmark, not the whole market. Regional prices — Appalachia, Waha, New England citygates — routinely tell you what the benchmark will do next.
- Confusing a bull market for skill. Everyone is a genius in a cold snap. Keep a trade journal; the December column will humble the January one.
Where Natural Gas Fits Next to Crude and OPEC
Gas rewards specialists, but it does not exist in a vacuum. Permian associated gas ties supply to oil-drilling economics, so decisions made in Vienna reach Henry Hub through the rig count — our breakdown of how OPEC controls oil prices explains that machinery. And many gas traders run crude alongside: oil offers steadier trends, deeper global liquidity, and geopolitics instead of meteorology. The crude oil trading guide is the parallel pillar if you want both markets in your book.
Getting Started: A Sensible Path
Natural gas trading pays traders who respect its physics — storage, weather, pipes — and punishes tourists. A path that works:
- Learn the contract specifications cold: sizes, ticks, margins, expiration, settlement. Errors here are unforced.
- Paper trade one full storage report cycle, then trade micros (MNG) for at least a season. One MNG contract turns a $1,000 lesson into a $100 one.
- Follow the weekly EIA data and daily model runs until the market’s reaction function feels predictable-ish. Free EIA data covers most of what a retail trader needs.
- Work through our step-by-step guide to trading natural gas futures before committing real size, and keep Henry Hub pricing and supply and demand fundamentals as your reference library.
- Specialize. The traders who make consistent money in gas are gas traders, not generalists passing through during the exciting months.
The market will still be volatile next winter. Make sure you are still around to trade it.