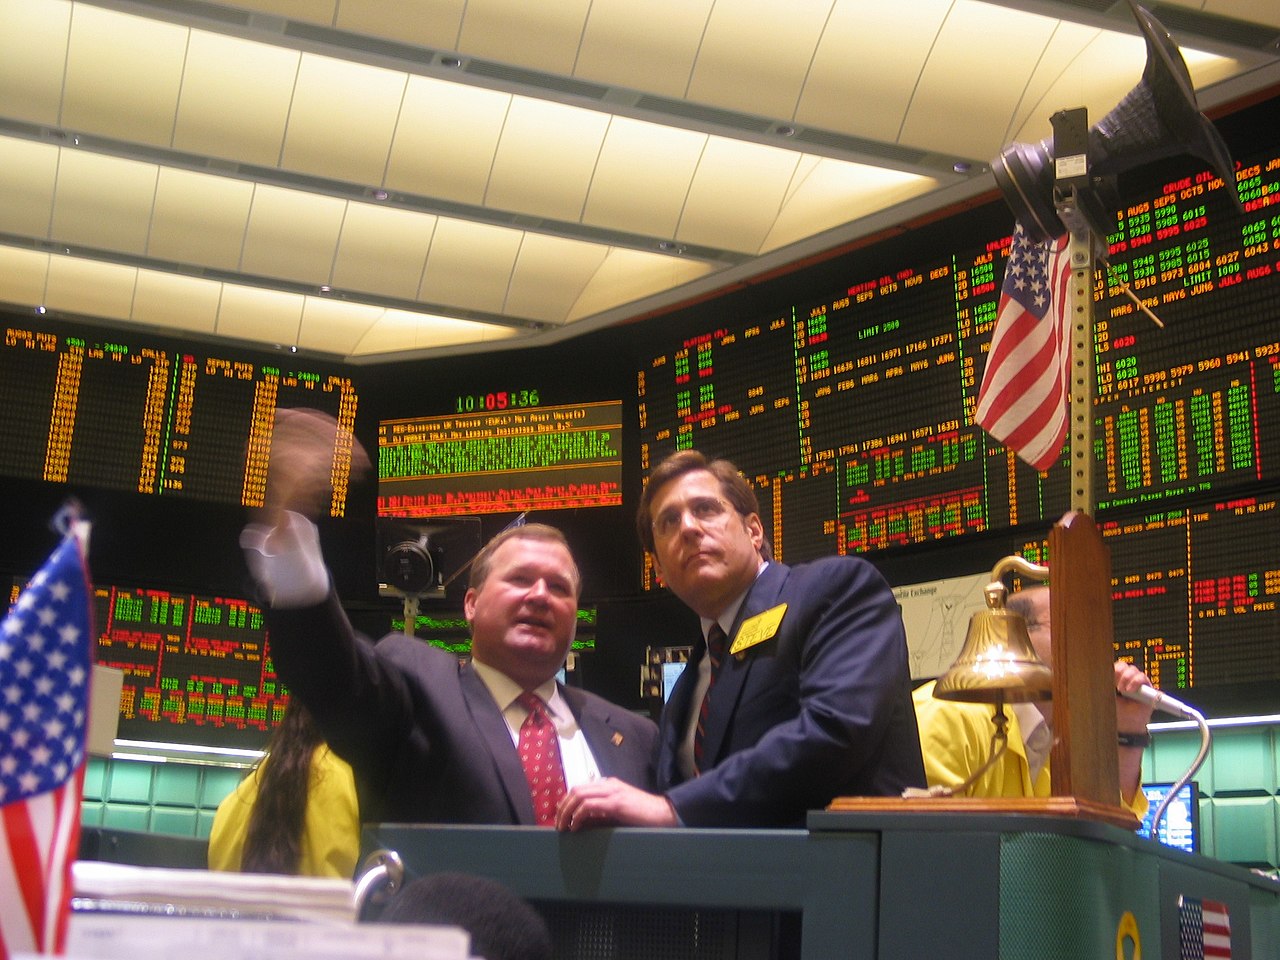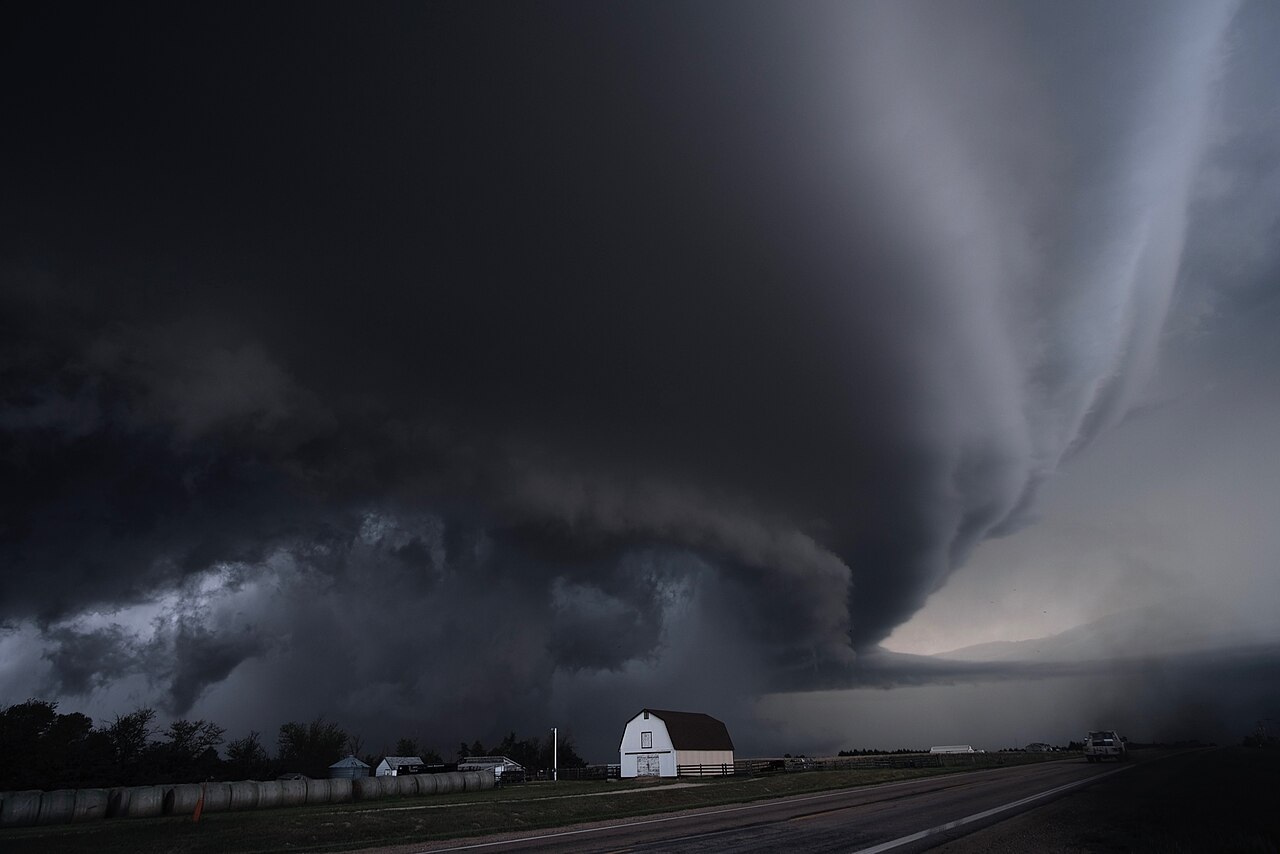
Weather forecasts are the single biggest short-term driver of natural gas prices, and weather natural gas trading is really forecast trading: the market does not move when it gets cold, it moves when the models say it will get cold. Every day, futures reprice on the gap between the newest weather-model run and the one before it. Master that loop and you understand most of what the front of the gas curve does on any given day.
This is not a niche skill. Natural gas heats roughly half of American homes and fuels about 40% of U.S. electricity generation, so a two-degree revision to a two-week temperature outlook rewrites billions of cubic feet of expected demand. Desks staff meteorologists; funds pay six figures for proprietary degree-day feeds; algorithms parse model output within seconds of release. This article explains what the models are, when they run, how the tape reacts, and how a disciplined trader can participate without being the slowest player at the table. For the broader market structure that all of this plugs into, see our complete natural gas trading guide.
Why Gas Is the Purest Weather Trade in Commodities
Crude oil demand barely notices a cold week. Gas demand explodes. The asymmetry comes from what gas is used for: space heating in winter, air conditioning (via gas-fired power) in summer. Both are direct functions of temperature, and neither can be postponed — nobody waits for lower prices to heat their house in January. Demand is price-inelastic exactly when it spikes, so price does all the adjusting.
The numbers are stark. U.S. gas consumption can run near 70 Bcf/d on a mild spring day and well beyond 150 Bcf/d during a severe cold snap, while production sits essentially flat in the 105–107 Bcf/d range. The difference comes out of storage, and the market’s entire pricing apparatus is a negotiation about how fast that storage will drain or fill. Weather forecasts are the input that moves the estimate; everything else — production trends, LNG flows, storage levels — sets the context in which a forecast change matters more or less. We cover that fundamental machinery in detail in our piece on natural gas supply and demand.
Cold is also a supply story, which is what makes winter weather doubly explosive. When temperatures drop far enough, wellheads freeze and production falls — the industry calls it freeze-offs — so the same Arctic outbreak that adds demand subtracts supply. February 2021’s Winter Storm Uri remains the defining example: Texas output collapsed while heating demand went vertical, physical gas at some Texas and Midcontinent hubs traded in the hundreds of dollars per MMBtu, and Henry Hub spot briefly cleared $20. Traders who only modeled the demand side of cold weather missed half the trade.
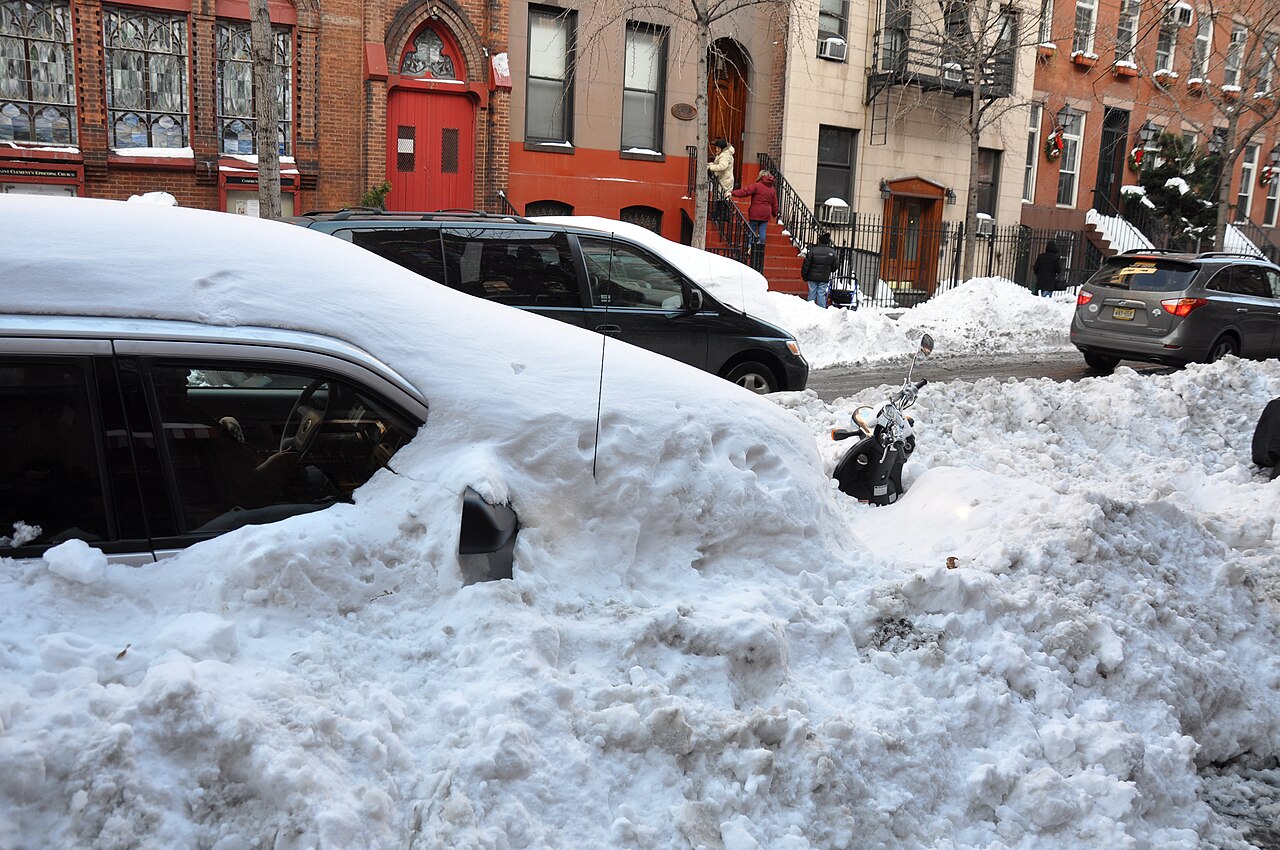
Degree Days: Turning Temperature into Demand
The market’s unit of account for weather is the degree day. Heating degree days (HDDs) measure how far the daily mean temperature falls below 65°F; cooling degree days (CDDs) measure how far it rises above. A 25°F January day in Minneapolis is 40 HDDs; a 95°F July day in Dallas is 30 CDDs. Vendors aggregate station-level readings into national totals weighted by population — or better, by regional gas consumption, producing gas-weighted degree days (GWDDs) that recognize a cold day in gas-heated Chicago as worth more demand than the same cold in electric-heated Seattle.
What trades is the change. A two-week outlook holding 380 HDDs is neither bullish nor bearish by itself; the market has already priced it. When the next model run prints 405, that is 25 HDDs of fresh demand — roughly speaking, each national HDD is worth several Bcf of incremental consumption — and the front of the curve jumps within seconds. The absolute forecast is context; the run-to-run delta is the event. Anyone who has watched gas futures spike at model release time without any visible headline has watched a degree-day delta being priced.
The Models: GFS, ECMWF, and the Ensembles
Two global models dominate gas-market attention. The American GFS (Global Forecast System), run by NOAA, updates four times a day — the 00z, 06z, 12z, and 18z cycles — and extends about 16 days out. The European ECMWF model runs its flagship cycles at 00z and 12z and is, by most verification statistics, the more skillful of the two; its reputation was cemented when it beat American guidance on Hurricane Sandy’s landfall track in 2012. Each has a companion ensemble — GEFS for the GFS, EPS for the European — which runs the model dozens of times with perturbed starting conditions to map the range of outcomes rather than a single answer.
| Guidance | Cycles (UTC) | Range | How the market uses it |
|---|---|---|---|
| GFS (operational) | 00z, 06z, 12z, 18z | ~16 days | Highest-frequency signal; every run can move the tape |
| ECMWF (operational) | 00z, 12z | ~10 days | The tiebreaker; the market trusts it more when models disagree |
| GEFS / EPS ensembles | With parent runs | 15–16 days (EPS to 15) | Spread = confidence; tight clustering emboldens positioning |
| CPC 6–10 / 8–14 day outlooks | Daily | Sub-seasonal | Free public benchmark from NOAA’s Climate Prediction Center |
| Weeklies / CFS / AI models (AIFS) | Varies | Weeks 3–6 | Position-building horizon; low skill, high leverage on winter strips |
Model output lands on trading desks on a rhythm every gas trader internalizes: an overnight European run digested before the U.S. morning, a morning GFS cycle that hits during peak liquidity late morning Eastern, and afternoon runs that can whipsaw the settle or the overnight session. Weekends are the famous gap risk — the market closes Friday afternoon and reopens Sunday at 6 p.m. ET having missed four to six model cycles. When those weekend runs flip cold in December, Sunday opens can gap 20, 30, even 50 cents. Carrying maximum size into a winter weekend is a choice you make about model risk whether you realize it or not.
Two practical reading rules. First, respect model divergence: when the GFS shows an Arctic outbreak and the European doesn’t, the market prices a probability, not a certainty, and the eventual convergence — one model capitulating to the other — is often a bigger move than the original signal. Second, watch the pattern drivers meteorologists watch: a sudden stratospheric warming that displaces the polar vortex, or a Madden–Julian Oscillation phase shift, telegraphs cold risk weeks ahead of the deterministic models. You do not need to be a meteorologist, but you need to know why your counterparties are suddenly bid.
Weather Natural Gas Trading in Practice: The Model-Run Loop
Here is the daily loop as it actually plays out. Before a major run drops, positioning quiets. The data releases, commercial feeds compute degree-day totals within seconds, and algorithmic flow hits the book first — retail traders reading a weather map twenty minutes later are trading against people who acted in milliseconds. The first move often overshoots: a run that adds 10 HDDs might pop the front month 8 cents, fade to +3 within the hour as humans contextualize the change (was it one model? is it inside the skillful window? does storage even make it matter?), and then drift on the next run’s confirmation or denial.
That structure suggests the honest ways to participate. Trading the release itself is a speed game you will lose. Trading the fade of an overreaction, or positioning ahead of likely model convergence, is a judgment game where experience pays. So is the storage filter: the identical 25-HDD addition is worth far more with inventories 10% below the five-year average than 10% above it, because tight storage removes the market’s tolerance for bad news. Context decides the multiplier on every forecast change; our breakdown of seasonal trading patterns in natural gas maps how that sensitivity shifts across the calendar — the same cold front that is a non-event in October is an emergency in February.
A Worked Example: Trading a Cold Shift in December
Say it is early December. Storage sits modestly below the five-year average, the front-month contract is at $4.50, and overnight guidance — both the European and the GFS — shifts the days 8–14 pattern decisively colder, adding roughly 20 HDDs versus the prior consensus. Both models agree, the change is inside the window the market takes seriously, and storage offers no cushion. That is about as clean as a weather signal gets.
A trader buys one January futures contract at $4.55 on the morning confirmation run. NYMEX Henry Hub contracts cover 10,000 MMBtu; each $0.001 tick is $10. The stop goes at $4.35 — the level where a model flip back to mild would land — risking 200 ticks, or $2,000. Over the next three sessions the cold verifies in successive runs, physical demand estimates ratchet up, and the contract trades $5.05. Exiting at $5.05 books 500 ticks: $5,000, a 2.5-to-1 payoff on the risk taken. The exit discipline matters as much as the entry: weather rallies die the moment the 15-day outlook warms, usually days before the actual cold peaks, because the market has already moved on to pricing the next two weeks. Sell when the models turn, not when the thermometer does. Execution mechanics, margin, and order types for trades like this are covered in our guide to trading natural gas futures.
Now run the failure branch honestly: the next European run erases half the cold, the front month gaps down through $4.40, and the stop fills at $4.33 for a $2,200 loss — slippage included, because weather gaps do not respect stop prices. That outcome is not a mistake; it is the cost of doing business in a market where the fundamental input rewrites itself four times a day. The mistake is the trader who removes the stop and argues with the model.
Extreme Events: When Weather Breaks the Market
Most weather trading is incremental — a few HDDs here, a heat-dome extension there. A few times a decade, weather stops being an input and becomes the entire market. Uri in February 2021 was the modern benchmark: a cold air mass parked over the middle of the country for a week, freeze-offs cut Texas production by several Bcf per day, wind turbines iced, and the physical market simply failed to clear at normal prices. The screen price on NYMEX told a fraction of the story; the violence was in cash markets and locational basis, where utilities paid whatever it took. Lessons that survived the event: physical and financial gas can decouple savagely; pipeline and grid infrastructure is a weather variable, not a constant; and the tails in this market are fatter than any options model calibrated to calm years suggests.
Summer has its own version. A persistent heat dome over Texas and the Southeast pushes power burn to records, and because air conditioning load is as non-negotiable as heating, multi-week heat events grind prices higher session after session — especially, again, when storage is thin. August 2022, with LNG exports already pulling on supply, saw front-month gas above $9/MMBtu, its highest since 2008.
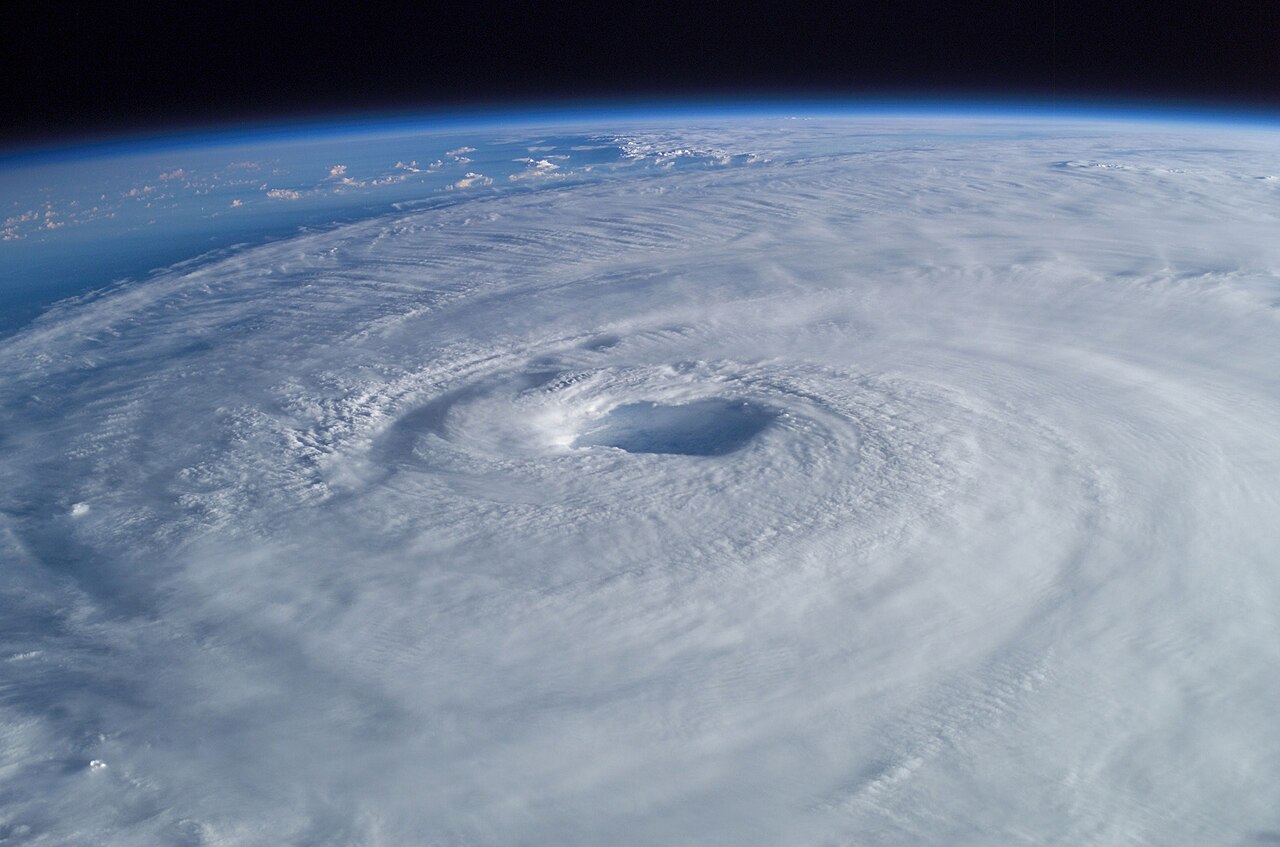
Hurricanes deserve a special note because their market sign has flipped. Twenty years ago a Gulf storm was automatically bullish — the offshore Gulf of Mexico then produced around a fifth of U.S. gas, and Katrina and Rita’s destruction helped drive futures to all-time highs in 2005. Today offshore Gulf output is only a small share of supply, while the Gulf Coast hosts the LNG export terminals and enormous industrial demand. A modern hurricane that shuts an export facility or blacks out demand centers is frequently bearish Henry Hub. Trade the storm’s actual footprint, not the reflex.
Which Contracts Move: The Forecast Horizon Ladder
Not every forecast change hits the whole curve equally, and matching the signal’s horizon to the right instrument is half the craft. A cold shift inside days 1–7 mostly moves the front month and cash: that gas gets burned before any other contract even becomes prompt. A days 8–15 shift is the front two months’ business. A sudden stratospheric warming signal or a La Niña winter outlook — weeks-to-months guidance — barely dents the prompt but reprices the whole winter strip, because the market moves the risk premium rather than the demand estimate.
This ladder explains price action that confuses newcomers. A brutal cold snap can hit today while February futures fall — because the 15-day outlook just turned mild, and February trades the future, not the present. It also explains why long-range winter forecasts issued in October move markets despite their thin skill: nobody trades them as predictions, they trade them as permission to build or shed winter risk premium early. Know which rung of the ladder your signal lives on, and put the position on that rung.
Basis: Where Weather Gets Local
Henry Hub is the benchmark, but weather demand is regional, and the wildest weather trades in gas happen in locational basis — the spread between a regional hub and Henry. New England is the classic case: pipeline capacity into the region is chronically tight, so a January cold snap can send Algonquin city-gate cash prices to several times Henry Hub while the NYMEX screen barely blinks. Southern California has produced the same dynamic when storage and pipeline constraints bite. During Uri, the definitive basis blowout, Midcontinent hubs that normally trade within cents of Henry printed in the hundreds of dollars.
Futures traders without physical books can still trade this via exchange-listed basis contracts, but the more important point is interpretive: regional weather does not always mean national price impact. A Northeast cold snap with a warm South can leave national degree-day totals — and Henry Hub — unimpressed while New England pays fortunes. When you read a bullish weather headline, ask where the cold lands, how much gas heating that region uses, and whether the pipes can physically deliver more gas there. If they cannot, the price response happens in basis, not in the contract you are holding. The mechanics of how the benchmark itself is set are covered in our explainer on Henry Hub pricing.
The Trader’s Weather Toolkit
You can build a functional weather desk on a retail budget, as long as you are honest about the speed disadvantage:
- NOAA’s Climate Prediction Center publishes free 6–10 and 8–14 day temperature outlooks daily — the public benchmark every paid product is trying to beat. Start there.
- Commercial degree-day services (the products gas desks actually watch) compute HDD/CDD and gas-weighted totals from every model run in near real time and flag run-to-run changes. This is the layer that turns maps into tradeable numbers.
- The EIA’s weekly storage report closes the loop: it tells you, every Thursday at 10:30 a.m. ET, whether the weather-demand estimates the market traded actually showed up in the inventory data. The EIA Natural Gas Weekly Update pairs the numbers with demand commentary and is free.
- Model verification awareness: skill degrades fast past day 7–10. Days 1–5 are high-confidence; days 8–14 are probabilistic; weeks 3–4 are barely better than climatology. Size positions accordingly — conviction sized to a day-13 signal is how accounts die.
And a structural warning: do not trade weather through front-month gas ETFs on multi-week horizons. The forecast can be right while roll costs in a contango market eat the position alive. Futures and options on futures (CME codes NG and LN — specs on the CME Group site) put the exposure where the thesis lives.
One development worth tracking through 2026: machine-learning weather models. ECMWF now runs an operational AI forecast system (AIFS) alongside its physics-based model, and Google DeepMind’s GraphCast demonstrated that learned models can beat traditional guidance on some medium-range metrics at a fraction of the compute cost. For gas traders the near-term implication is more model runs, delivered faster, with genuinely independent errors — which means more run-to-run deltas to trade and, at least for a while, an edge to whoever integrates the new guidance before consensus does. Every previous improvement in forecast skill has compressed the market’s reaction window; this one is unlikely to be different.
Winter Playbook vs. Summer Playbook
Weather trading is really two different games depending on the season, and importing winter habits into summer (or vice versa) is a quiet source of losses. In winter, the demand response to a forecast change is enormous and immediate — each incremental HDD represents heating load that must be served — so moves are fast, gaps are common, and the skew in options pricing leans hard toward upside tails. Winter weather trades want defined risk, quick exits, and deep respect for the weekend model cycle. The violent moves cluster between mid-November and early February, when there is still enough winter left for a cold pattern to threaten the storage endgame.
Summer is a slower grind. Heat adds power burn, but coal-to-gas switching and demand response cap the upside in normal years, so heat rallies build over weeks rather than exploding overnight. The summer trader’s edge is persistence analysis: heat domes tend to hold and rebuild, so the pattern that matters is whether the upper-level ridge re-establishes in the extended guidance, not whether tomorrow hits 100°F. Late summer adds the hurricane subplot, which since the LNG buildout cuts both ways. And the shoulder months — April–May, October — are when weather signals are weakest and traders manufacture conviction they should not have: a warm week in late April simply does not matter to a market with six months of injection flexibility ahead of it. The best weather traders are, above all, selective about when weather is even the right game to play.
Positioning: The Other Half of Every Weather Move
The same forecast change produces wildly different price responses depending on who is already positioned for it, which is why weather traders read the CFTC’s weekly Commitments of Traders data alongside the models. When managed money is heavily short and a cold signal appears, the move is amplified by covering — the 2018 November spike, when gas ran from under $3.30 to nearly $5 in weeks on early cold and thin storage, was as much a positioning fire as a weather event. When funds are already max long winter and the cold arrives on schedule, the news can sell off: everyone who wanted to buy it already had.
The practical habit: before treating a model shift as a trade, ask what the market’s pain trade is. A bullish forecast into a short market is a rocket; the identical forecast into a long, complacent market is often a fade. Weather supplies the spark; positioning supplies the fuel.
Why Most Retail Traders Lose the Weather Game
Harsh but useful: the average retail trader loses money trading weather in gas, and the reasons are structural. They react to model runs minutes after algorithms have repriced them. They treat a 14-day forecast as a fact rather than a distribution. They hold through weekends unhedged in January. They confuse a correct weather forecast with a correct trade — buying cold that storage can comfortably absorb, or that the strip already priced during the previous week’s model flirtation. And they size positions for the calm weeks, then meet the volatile ones.
The professionals’ edge is rarely better meteorology. It is better context (storage, positioning, seasonality), better structure (spreads and options instead of naked front-month risk), and the discipline to treat every forecast as provisional. The weather will surprise everyone several times a season; the game is arranging your positions so surprises are survivable and occasionally very profitable. Options are the natural instrument for that: owning calls into a cold-risk pattern costs a known premium and turns a model flip from a stop-out into a shrug.
Weather is the heartbeat of this market — the reason natural gas offers more tradeable volatility, more often, than anything else on the energy screen. It is also the reason the market humbles tourists. Learn the model rhythm, translate everything into degree-day deltas, filter every signal through storage, and keep your size honest. For the full framework around this — contracts, participants, seasonality, and strategy — return to our complete natural gas trading guide.