Natural gas seasonal trading patterns are among the most reliable calendar effects anywhere in commodities. Prices typically bottom in the spring shoulder season (April–May), firm through summer as power-plant cooling demand peaks, build a risk premium into October and November ahead of heating season, and hit their highest — and wildest — levels between December and February. The driver is physical: demand swings violently with the weather, while production barely moves.
That reliability is exactly what makes the patterns dangerous. Every professional on a gas desk knows the seasonal map by heart, which means the obvious trades are crowded, and the years when the pattern breaks are the years that end careers. Ask anyone who was short the March/April spread in September 2006, or long it in December 2021. This article lays out the storage cycle that creates the seasonality, walks through each season’s typical behavior, prices out the infamous widow maker spread with real contract math, and looks at how LNG exports are quietly rewriting rules that held for thirty years. If you are newer to this market, start with our complete natural gas trading guide and come back — this piece assumes you already know what a Henry Hub futures contract is.
The Storage Cycle That Drives Everything
Natural gas is hard to store. Crude oil sits happily in a tank for years; gas has to be compressed into depleted reservoirs, aquifers, and salt caverns, and the total working capacity of the U.S. storage system tops out at roughly 4 trillion cubic feet. Against that buffer, consumption swings from a summer baseline in the 70s of Bcf per day to well north of 150 Bcf/d on the coldest winter days. Dry gas production, meanwhile, runs essentially flat around 105–107 Bcf/d regardless of season. Storage is the shock absorber, and price is the mechanism the market uses to manage it.
The year divides into two halves. Injection season runs roughly April through October: production exceeds demand, and the surplus is pushed into storage. Withdrawal season runs November through March: heating demand overwhelms production, and the market lives off inventory. The EIA’s weekly storage report, released Thursdays at 10:30 a.m. ET, is the scoreboard for this game, and the market grades every week’s injection or withdrawal against the five-year average for that calendar week.
The seasonal extremes tell you how much room there is between comfort and panic. In strong years, working gas in storage peaks just above 4,000 Bcf in early November — the record was set in November 2016. After the brutal polar-vortex winter of 2013–14, inventories bottomed near 820 Bcf, the lowest end-of-season level in over a decade, and the market spent the entire following summer paying producers to refill the system. Every seasonal price pattern in this market is, at bottom, the market solving that inventory problem: prices fall in spring to encourage injections, and rise in autumn to ration what has been stored. The deeper mechanics of that balance are covered in our piece on natural gas supply and demand.
One more structural point. Because storage smooths the physical market, the futures curve carries the seasonality instead. Winter contracts (November through March, month codes X, Z, F, G, H) trade at a premium to summer contracts (April through October, codes J through V) in almost every year. Traders talk about the “winter strip” and “summer strip” as single units, and the spread between them is a tradeable expression of how tight the market expects the coming winter to be.
Natural Gas Seasonal Trading Patterns, Month by Month
Seasonal studies of Henry Hub futures going back decades show consistent tendencies — not certainties — in how each part of the year trades. Here is the map most desks carry in their heads:
| Period | Season | Typical price behavior | What actually moves the tape |
|---|---|---|---|
| December–February | Peak winter | Highest prices and highest volatility of the year; violent spikes on cold snaps, equally violent fades when forecasts warm | Heating degree days, storage draws vs. five-year average, freeze-offs cutting supply |
| March | Late winter / bridge | Risk premium bleeds out fast once the end of winter is in sight; occasional late-cold ambushes | End-of-season storage estimate, the March/April spread unwind |
| April–May | Spring shoulder | Seasonal lows in many years; quiet, range-bound; historically a surprisingly bullish month for futures returns as the market prices the refill task | Early injection pace, production trends, nuclear plant maintenance |
| June–August | Summer power burn | Second demand peak; heat waves can rally the front of the curve hard, especially when storage is below average | Cooling degree days, power-sector gas burn, LNG feedgas demand |
| September–October | Autumn shoulder | Pre-winter risk premium builds; September skews bullish in seasonal studies; hurricane headlines add noise | End-of-injection storage trajectory, winter weather model chatter, Gulf storm tracks |
| November | Early winter | First real heating demand; market decides whether the winter premium was justified | First cold shots, early withdrawal numbers |
Two warnings before you trade any of it. First, the tendencies are averages built from wildly different years — a “bullish April” statistic includes years when April rallied 30% and years when it went nowhere. Second, everyone has this table. A seasonal tendency only pays when the current year’s storage and weather situation actually supports it; the calendar alone is not an edge.
Degree Days: The Unit of Seasonal Demand
The whole seasonal complex is quantified through degree days, and you cannot read gas commentary without them. A heating degree day (HDD) measures how far the daily average temperature falls below 65°F; a cooling degree day (CDD) measures how far it rises above it. A January day averaging 30°F in Chicago contributes 35 HDDs; a 95°F August day in Houston contributes 30 CDDs. Forecast vendors aggregate these into population-weighted national totals, and the market trades the changes: a weather-model run that adds 15 HDDs to the two-week outlook in December is worth real money to the front of the curve, while the same 15 HDDs in October barely register because there is still storage flexibility to absorb them.
This is why identical weather headlines produce different price reactions in different months. Cold in November is interesting; cold in February with storage below 1,500 Bcf is an emergency. The degree-day totals only matter relative to what the storage trajectory can tolerate — which is the single most useful filter for deciding whether a weather rally has legs or is just noise.
The strip logic matters for execution, too. If your view is “this winter will be tight,” buying the front month in October expresses it badly — the front month expires before the cold arrives and hands you roll risk every month. Buying January outright, or the November–March strip, puts the position where the thesis lives. Conversely, producers hedge by selling the summer strip against their injection-season output, which is part of why spring rallies so often stall: every uptick gets met with hedging supply from companies that need to lock in refill economics.
Winter: Where the Volatility Lives
From December through February, natural gas is the most volatile major futures contract in the world. Implied volatility on winter options routinely runs multiples of what you see in crude, and the reason is simple arithmetic: on a cold day, U.S. heating and power demand can exceed total production by 40 or 50 Bcf, and every one of those Bcf has to come out of storage or out of someone else’s consumption. Price is the rationing tool, and when the weather models shift a polar outbreak two hundred miles east, billions of dollars of expected demand appear or vanish overnight.
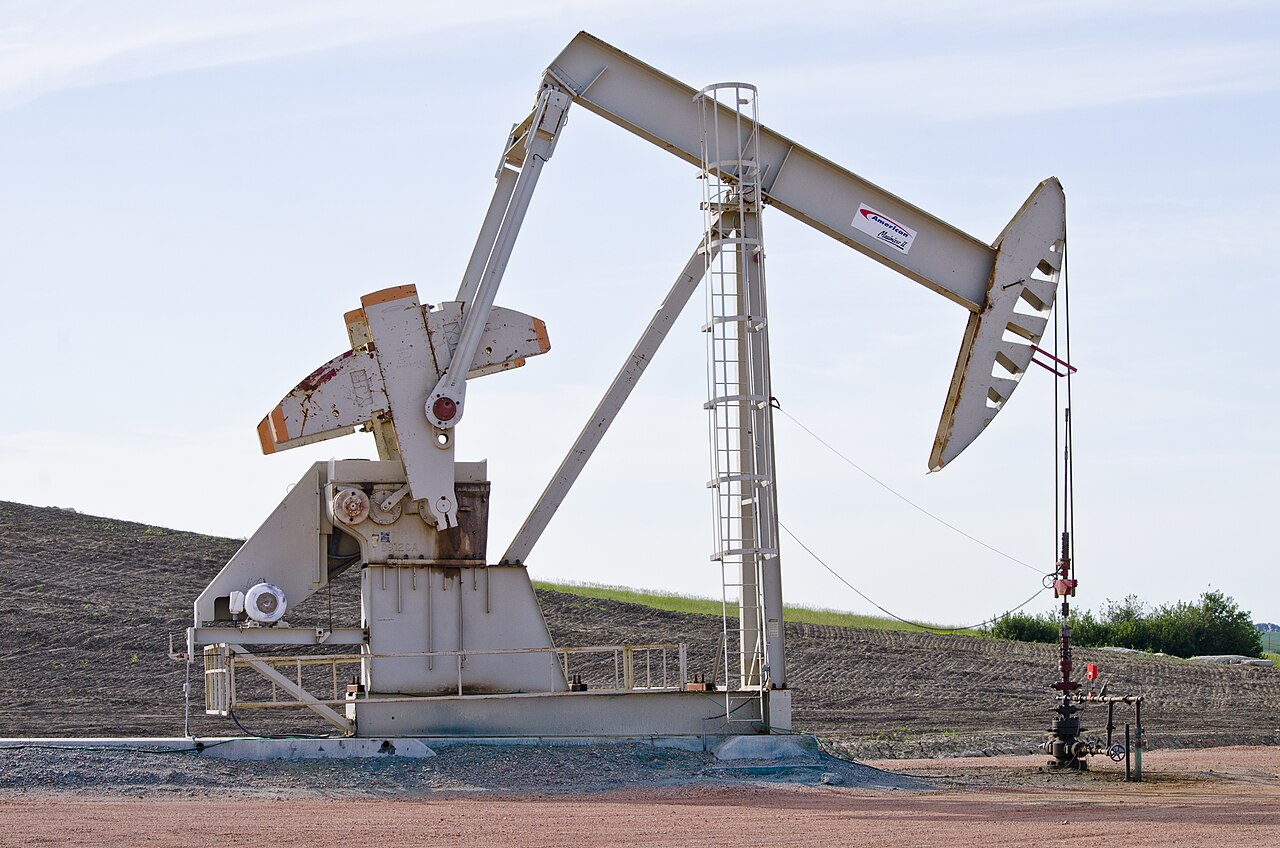
Winter also carries a nasty asymmetry: the same cold that spikes demand can cut supply. When wellheads and gathering lines freeze — “freeze-offs” — production drops exactly when consumption peaks. Winter Storm Uri in February 2021 was the textbook case. Texas production collapsed by many Bcf per day just as heating demand exploded; physical gas at some Texas and Midcontinent hubs printed in the hundreds of dollars per MMBtu, and even Henry Hub spot briefly traded above $20. Futures moved far less than physical cash prices did, which is the enduring lesson of Uri: in extreme winter events, the real violence happens in the cash market and in locational basis, not in the NYMEX screen price. If the distinction between cash, basis, and futures is fuzzy, our explainer on Henry Hub pricing walks through it.
For futures traders, the practical winter rules are: expect gaps (gas reprices hard on weekend weather-model runs, and Sunday night opens can be brutal), respect the margin requirements (exchanges raise them in winter for a reason), and understand that winter rallies are usually sold violently the moment the 15-day forecast warms. The market is not pricing today’s weather; it is pricing the storage trajectory through the end of March.
The March/April Widow Maker
The most famous seasonal trade in natural gas is the spread between the March and April contracts — H versus J in month codes. March is the last month of withdrawal season; April is the first month of injection season. The spread is therefore a pure bet on how scary the end of winter will be: buy March/sell April if you think cold weather or low storage will make the market panic about running out of gas, and the spread widens. If winter fizzles, March collapses onto April and the spread grinds toward zero. Traders call it the widow maker, and the name is earned.
The math is straightforward. Each NYMEX Henry Hub contract covers 10,000 MMBtu, and the minimum tick of $0.001/MMBtu is worth $10 per contract, so a one-cent move in the spread is $100 per spread. Say you buy the March/April spread at a 25-cent premium in the summer, betting on a tight winter. A genuine storage scare that pushes the spread to 75 cents makes you $5,000 per spread. A warm December that crushes it to 5 cents costs you $2,000. Those are the polite scenarios. In the autumn of 2021, with storage below average and Europe already in crisis, the spread blew out to well over a dollar — then gave almost all of it back within weeks when a mild December arrived. Ten spreads on, that round trip was a six-figure swing. Contract mechanics, margining, and execution for trades like this are covered in our guide to trading natural gas futures.
And then there is Amaranth. In September 2006, the hedge fund Amaranth Advisors — roughly $9 billion under management — lost about $6 billion in a matter of weeks, mostly on enormous natural gas calendar-spread positions built around long winter/short summer structures, including the March/April 2007 spread. Trader Brian Hunter had ridden the same positions to huge profits in 2005 when hurricanes Katrina and Rita wrecked Gulf production. In 2006, storage was comfortable, no storm came, the spreads collapsed, and the positions were far too large to exit. The fund was gone within a month. Every lesson in that episode is still current: a spread is not automatically low-risk; seasonal logic is not a hedge against position size; and liquidity in the out months is a fair-weather friend.
Summer Power Burn: The Second Season
The old-timers’ version of gas seasonality had one demand peak: winter. That world is gone. Natural gas now fuels roughly 40% of U.S. electricity generation, and July–August air-conditioning load has become a genuine second demand season. When a heat dome parks over Texas and the Southeast, power-sector gas burn sets records, injections stall, and the front of the curve can rally hard — particularly if storage is already below the five-year average. August 2022 was the modern showcase: with LNG exports pulling on the same supply, front-month gas traded above $9/MMBtu, its highest level since 2008, in the middle of what the old seasonal map called the off-season.
Summer also has a stabilizer that winter lacks: coal-to-gas switching. When gas gets expensive, power generators that can burn coal do so, releasing gas back into storage; when gas gets cheap, the switch runs the other way. That substitution puts a soft floor and ceiling around summer prices in normal years, which is why summer volatility, while real, rarely reaches winter’s extremes. The trading implication: summer heat rallies are usually capped unless storage is genuinely short, so chasing the third week of a heat wave is often buying the top.
Shoulder Seasons: Quiet, Until They Are Not
April–May and October are the market’s breathing spaces. Heating demand is gone or not yet arrived, cooling demand is minimal, and injections tick along. Volatility compresses, ranges tighten, and the tape gets dominated by supply-side stories: production growth, pipeline maintenance, LNG feedgas swings. For outright traders it is the least interesting time of year. For spread traders it is the most important, because the shoulder is when winter positions get built at reasonable prices. The autumn shoulder in particular is when the winter risk premium gets priced: seasonal studies consistently flag September as one of the more bullish months for gas futures, which is less a mystery than a mechanism — that is when the market stops guessing about end-of-October storage and starts worrying about January.
The shoulder seasons are also when the futures curve’s shape quietly taxes the unwary. In a typical contango (near months cheaper than deferred), long ETF positions like UNG bleed value every month as the fund rolls from a cheaper expiring contract into a more expensive one. Holding a gas ETF through the spring shoulder to “wait for winter” has destroyed more retail accounts than any single price crash; the roll cost compounds relentlessly. If you want winter exposure in May, the honest instruments are the winter futures contracts themselves or options on them, not a front-month tracker.
Hurricanes Switched Sides
For decades, the September seasonal rally had a co-author: the Gulf of Mexico. In the early 2000s the offshore Gulf produced roughly a fifth of U.S. natural gas, and a major storm through the production fairway was violently bullish — hurricanes Katrina and Rita in August–September 2005 knocked out most Gulf output and helped drive futures into the mid-teens that autumn, then an all-time high near $15.78 that December.
The shale revolution flipped the sign. Offshore Gulf gas is now only around 2% of U.S. production, while the Gulf Coast hosts the country’s LNG export terminals and a huge share of industrial demand. A modern hurricane is as likely to be bearish Henry Hub — shutting export facilities and destroying demand through power outages — as bullish. Traders who learned the market before 2010 had to unlearn the storm reflex; traders who learned it after sometimes over-apply the new logic to storms that threaten producing basins like Haynesville feeder infrastructure. The honest rule: hurricanes move gas, but you have to look at what is actually in the cone.
How LNG Exports Rewired the Map
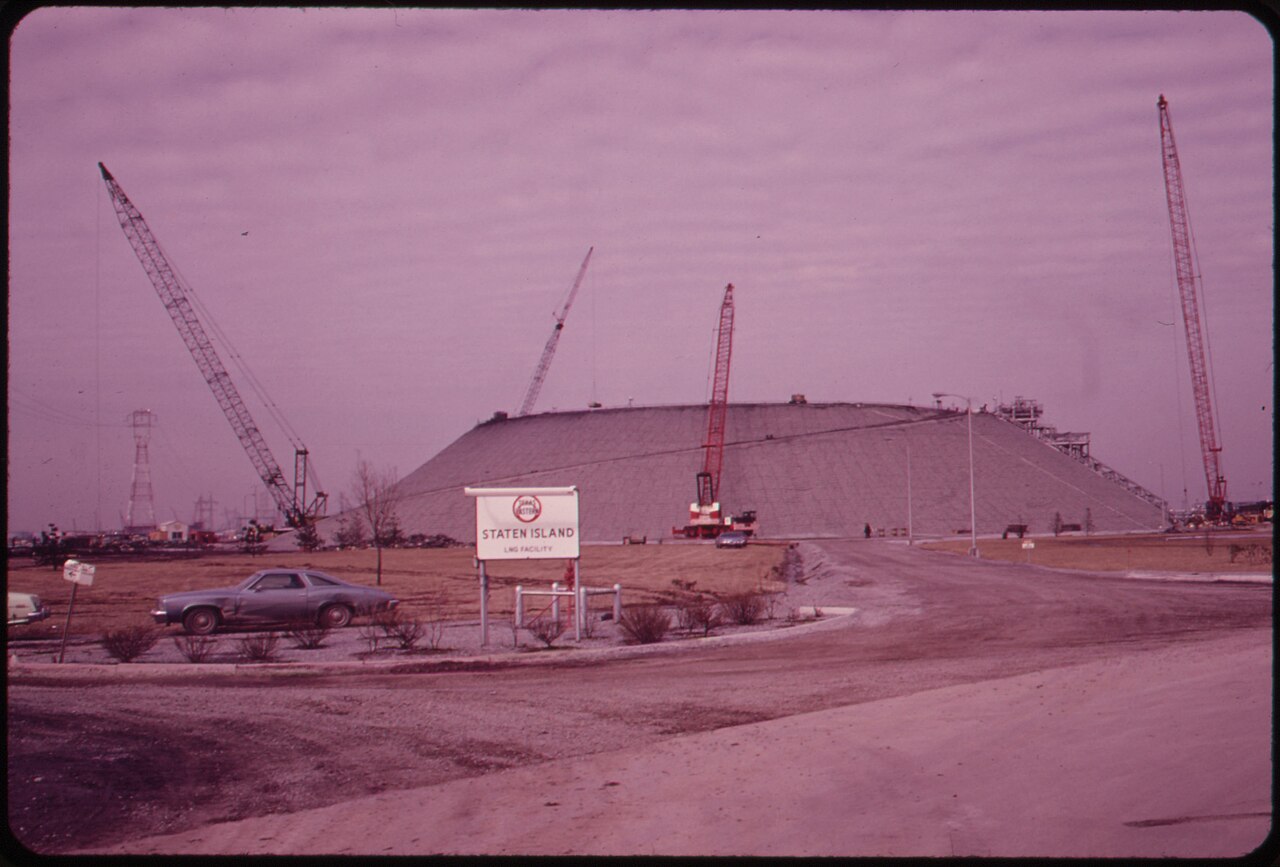
The biggest structural change to gas seasonality since shale is that the U.S. now exports double-digit Bcf/d of LNG. From the first Sabine Pass cargo in 2016, feedgas demand has grown into the mid-teens of Bcf per day and is still climbing as Plaquemines, Corpus Christi Stage 3, and Golden Pass ramp up. That volume runs year-round, which does two things to the seasonal pattern. First, it raises the demand floor in the shoulder seasons, making the old “gas is free in May” lows harder to reach. Second, it imports other hemispheres’ weather into Henry Hub: a European storage panic or an Asian heat wave now bids up U.S. export demand regardless of what the U.S. calendar says.
The June 2022 Freeport LNG explosion demonstrated the linkage in reverse. One facility outage stranded roughly 2 Bcf/d of gas in the domestic market overnight; Henry Hub futures fell hard over the following weeks while European prices, deprived of the cargoes, rose. A domestic gas trader was suddenly carrying exposure to a fire at an export terminal — a risk that did not exist in this market fifteen years ago. Expect the seasonal map to keep evolving as export capacity grows; the EIA’s Natural Gas Weekly Update tracks feedgas volumes and is worth a standing bookmark.
A Worked Example: Buying the Autumn Risk Premium
Here is how a seasonal thesis actually becomes a position. Suppose it is early September, injections have run below the five-year average all summer because of heat and strong LNG feedgas demand, and the projected end-of-October carryout is around 3,400 Bcf — comfortable, but with no cushion for a cold start to winter. The seasonal tendency (September strength, October premium-building) and the fundamental picture (below-average storage) point the same direction. That alignment is the setup; either one alone is not.
A futures trader might buy one January contract — the heart of winter — rather than the front month, because January is where the weather risk premium accumulates. Entry at, say, $4.20, with a stop at $3.90: that is 300 ticks at $10 each, so $3,000 of defined risk per contract. The target is not a price so much as an event: the position is exited into the first genuine cold-driven rally of November or December, when the risk premium you bought cheap in September is being paid up for by whoever waited. If storage surprises to the upside and the carryout estimate climbs toward 3,700 Bcf instead, the thesis is dead and the stop does its job — the pattern failed this year, and the discipline is to take the $3,000 loss rather than argue with the refill data.
Notice what the structure avoids: no exposure to the widow-maker March/April unwind, no ETF roll bleed, no need to predict a specific weather event. It monetizes the one seasonal effect with a genuine mechanism behind it — the market’s habit of underpricing winter risk in early autumn and overpaying for it once the cold shows up.
There is also a new seasonal sub-pattern worth watching: European storage refill. EU rules and utility behavior concentrate European buying between April and October, which now overlaps exactly with the U.S. injection season. In tight global years the two hemispheres compete for the same summer cargoes, supporting Henry Hub through what used to be its softest months. In loose years — mild European winter, full storage by August — feedgas economics can sag and hand the U.S. market back its old spring weakness. Reading gas seasonality in the 2020s means reading two continents’ calendars, not one.
Trading the Map Without Getting Carried Out
A few rules that separate people who use seasonality from people who get used by it:
- Seasonals are context, not signals. “It’s September, so buy” is not a trade. “It’s September, storage is 8% below the five-year average, and the winter strip hasn’t priced it” is a trade. Always condition the calendar on the current storage and weather picture.
- Size for winter volatility, not summer volatility. A position that felt comfortable in a 3-cent daily range in May will move 30+ cents a day in January. At $10 a tick per contract, a 30-cent day is $3,000 per contract. Cut winter size accordingly, before the market does it for you.
- Respect the report calendar. The Thursday 10:30 a.m. ET storage number regularly prints 10–20 cent instant moves. Carrying a full position blind into that release is a coin flip with leverage.
- Use options to define winter risk. Options on gas futures (CME code LN) let you own winter upside with known downside. They are not cheap in October — the market knows what season it is — but a defined-risk structure survives the forecast whipsaws that stop out futures positions.
- Study the failure years. The warm winters of 2011–12 and 2015–16, the demand collapse of 2020, the Freeport surprise of 2022 — each one ambushed pure seasonal players. Know what broke the pattern before you bet on it holding. Full specifications for the underlying contract are on the CME Group’s Henry Hub futures page.
Seasonality is the skeleton of the natural gas market: everything else — weather forecasts, storage reports, LNG flows — hangs off it. But a skeleton is not a trading system. Treat the calendar as your map of where the market’s attention will be, layer the current year’s fundamentals on top, and size every position for the season you are actually in. For the broader framework — instruments, participants, and how gas fits into an energy portfolio — go back to the complete natural gas trading guide.