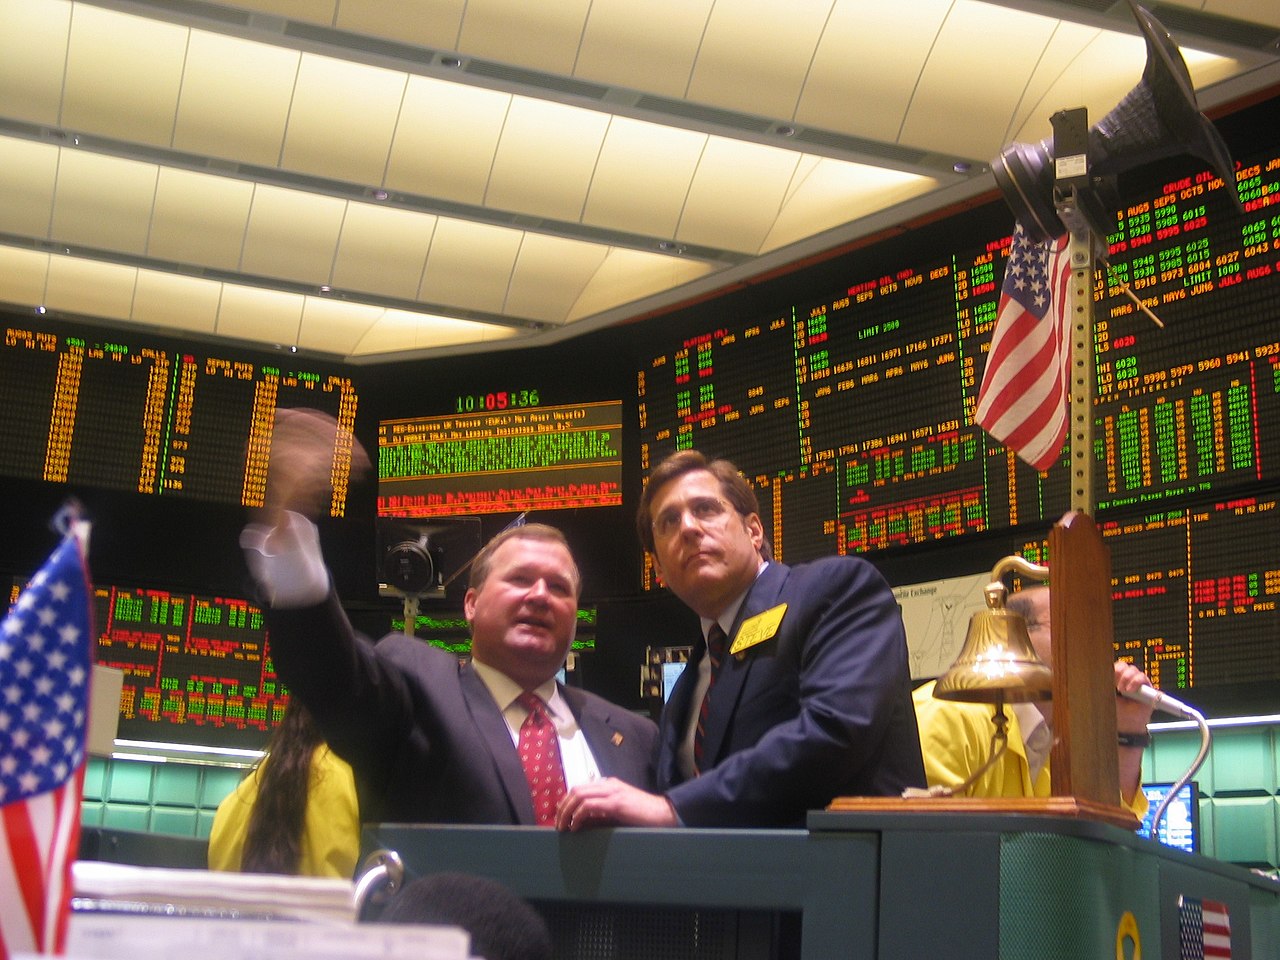
Natural gas is the purest supply-and-demand market in commodities. There is no cartel managing it, no strategic reserve to release, and – until LNG changed things – no way to ship the surplus somewhere else. Natural gas supply and demand meet in storage arithmetic and weather forecasts, and the price does whatever it must to balance them, which is why Henry Hub routinely moves more in a week than crude moves in a quarter. This guide builds the fundamental picture a gas trader actually uses; it pairs with our complete natural gas trading guide, which covers execution, contracts and strategy.
The Supply Machine: How the US Got to ~120 Bcf/d
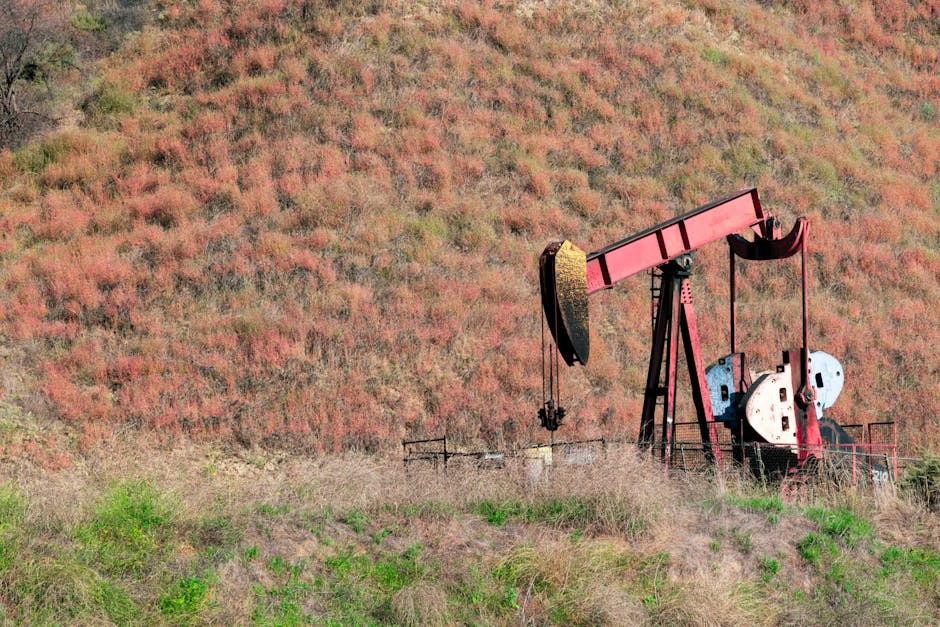
US dry gas production – tracked in detail in the EIA’s Natural Gas Weekly Update – has roughly doubled since the shale revolution took hold – from about 55 Bcf/d (billion cubic feet per day) in 2010 to the neighborhood of 120 Bcf/d today, after crossing 90 Bcf/d around 2020. That climb turned the US from a structural importer, fretting about LNG import terminals in the 2000s, into the world’s largest LNG exporter. It also fundamentally changed price behavior: the pre-shale market delivered $10-15 spikes whenever supply tightened; the post-shale market spends most of its life grinding between $2 and $4, because supply responds too fast for scarcity to persist.
The Price History That Explains the Psychology
A quick tour of Henry Hub’s extremes explains how gas traders think. Pre-shale, scarcity ruled: hurricanes Katrina and Rita shut in Gulf production in 2005 and prompt prices spiked into the mid-teens per MMBtu; 2008 saw $13 gas on tight supply and oil-linked mania. Then shale arrived and spent a decade teaching longs humility – below $2 in 2012, $1.60 in 2016, and a pandemic low near $1.50 in 2020, each dip driven by supply growth that simply would not stop. The 2021-2022 whiplash – Uri’s regional chaos, then $9-10 Henry Hub as Europe bid for every spare molecule – reminded everyone the upside tail still exists, before 2023-2024 delivered sub-$2 prints again on record production. The lesson embedded in that history: gas spends years boring you and days ruining you. Position sizing has to respect the days, because the boring years are precisely what convince traders to oversize just before the ruinous ones.
Where the Gas Comes From
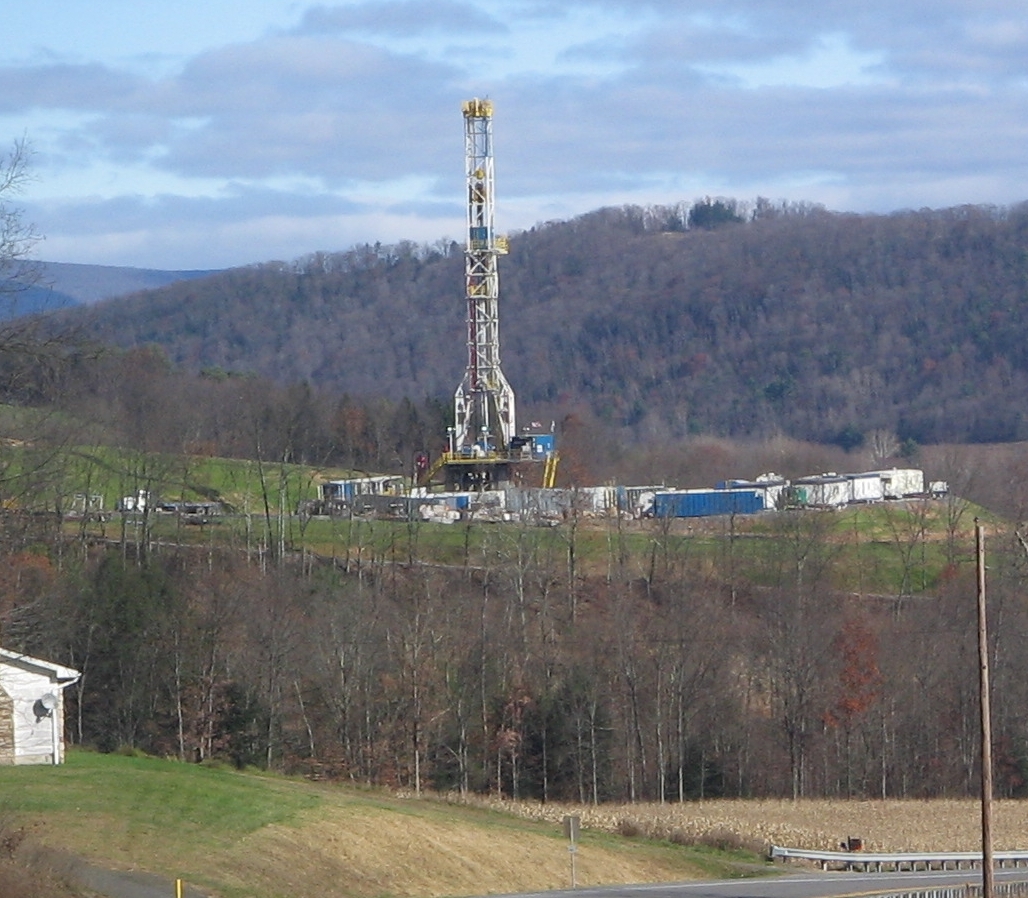
Production is concentrated in a handful of basins, and the concentration matters because each basin responds to different incentives:
- Appalachia – the Marcellus and Utica (PA, WV, OH): ~35-37 Bcf/d, roughly 30 percent of US supply. The largest gas field complex in the country, with low breakevens and one chronic constraint: pipeline takeaway. New pipe out of the Northeast is nearly impossible to permit, so Appalachian growth has flatlined regardless of price – a supply cap written in regulatory ink.
- Permian Basin (TX, NM): ~25 Bcf/d and growing. Associated gas – a byproduct of oil drilling. More on why that matters below.
- Haynesville (LA, East TX): ~14-16 Bcf/d. Deep, expensive, hot – breakevens above Appalachia’s – but sitting on top of the Gulf Coast LNG corridor. The Haynesville is the swing basin: it accelerates when prices reward drilling and stalls first when they do not.
- The rest: Eagle Ford, Anadarko/SCOOP-STACK, Rockies, Bakken and offshore Gulf collectively contribute the balance, mostly mature or declining.
Associated Gas: Supply That Ignores the Gas Price
A structural quirk every gas trader must internalize: a large and growing slice of US supply is drilled for oil, not gas. Permian operators make drilling decisions on WTI economics; the gas comes up regardless and must go somewhere. When gas pipelines out of West Texas fill up, the local price at the Waha hub collapses – it has traded negative repeatedly, most notably through stretches of 2019 and 2024, with producers literally paying to have gas taken away rather than shutting in profitable oil wells.
The consequence: gas supply keeps growing even when Henry Hub prices are uneconomic for gas-directed drilling, as long as oil prices support Permian activity. Bearish gas theses built on “low prices will cut supply” routinely die on this rock. Watch oil rig counts as a gas supply indicator – it sounds wrong and is exactly right.
How Natural Gas Supply and Demand Set the Price
The balance mechanics are the same as any commodity – production plus imports plus storage withdrawals must equal consumption plus exports plus injections – but gas adds two amplifiers that make it uniquely violent.
First, demand swings enormously and involuntarily. Weather is the demand curve: a severe cold snap can add tens of Bcf per day of heating and power demand within 48 hours, against a market that consumes roughly 100 Bcf/d nationally in an average winter week. No other major commodity sees double-digit percentage demand moves on a forecast revision.
Second, neither side can flex on trading timescales. Production is effectively fixed over days-to-weeks; nobody drills a well because Thursday is cold. Consumers do not stop heating homes because prices tripled – short-run demand elasticity is close to nil for residential load. The only shock absorber is storage, which is why gas traders talk about storage the way equity traders talk about earnings. When a demand shock arrives with storage comfortable, prices firm modestly. When the same shock arrives with storage low, prices go vertical, because the market must ration demand by force – shutting industrial plants and pricing power generators into fuel-switching. That mapping from inventory cushion to price violence is the single most important idea in gas fundamentals, and it is the same inventory logic that drives crude – compared side by side in our guide to oil supply and demand fundamentals – just played at ten times the tempo.
How Fast Can Supply Respond?
The supply response function is the other half of the price mechanism, and it is asymmetric. On the way up, gas-directed drilling responds to sustained price strength in roughly two to four quarters: rigs return to the Haynesville first, wells spud, and volumes arrive six to nine months after the price signal. There is also a faster lever – the inventory of drilled-but-uncompleted wells and curtailed production that producers can turn on in weeks when prices justify it, which is why rallies driven purely by “supply cannot respond” theses keep dying earlier than their authors expect. On the way down, the response is slower and stickier: hedges lock in revenue for a year or more, associated gas ignores the gas price entirely, and companies protect production guidance until balance sheets force the issue. The practical translation: gas gluts last longer than gas scarcities, and the market’s long-run equilibrium sits closer to the cost of Haynesville supply – roughly $3-4 – than the panic prices of any given January.
Who Uses the Gas: Demand by Sector
US domestic consumption runs a bit under 90 Bcf/d averaged across the year, with LNG and pipeline exports on top. The sector split, roughly: power generation about 40 percent, industrial users about a third, and residential/commercial heating most of the rest – about a quarter combined, concentrated brutally into the winter months.
Power: The Big, Flexible Buyer
Power burn is the largest and most price-responsive demand block. Grid operators dispatch generation by marginal cost, so when gas is cheap it displaces coal, and when gas rips higher the remaining coal fleet claws back share – a fuel-switching band that historically buffered price moves, though it thins every year as coal plants retire. Gas also backstops renewables: calm, cloudy weeks mean more gas burn, and summer heat waves now move gas prices almost as much as winter cold, since air conditioning runs on a gas-heavy grid. The newest driver is data centers – AI and cloud load growing faster than any US power demand source in decades, with gas-fired generation winning much of that load on reliability grounds. Estimates vary widely, but several credible projections put incremental gas demand from data-center-driven power growth at multiple Bcf/d by 2030. It is the most genuinely bullish structural demand story US gas has had since LNG.
Because weather is the demand curve, gas desks are consumers of meteorology to a degree no other market matches. The GFS and European (ECMWF) models update multiple times daily, and futures reprice on run-to-run changes in projected heating and cooling degree days – a few degrees of revision across the populous Midwest and Northeast is worth several Bcf/d of demand. When the American and European models disagree about a cold outbreak ten days out, implied volatility rises to price the argument; when they converge, half the move happens before a single thermostat clicks. This is why intraday gas moves so often have no news attached: the news was a model run.
Industrial, Residential, Commercial
Industrial demand – petrochemicals, fertilizer (ammonia synthesis), steel, refining – is the stable base of the stack, tracking manufacturing activity rather than weather. Residential and commercial heating is the opposite: almost entirely weather-driven, with around half of the annual total consumed December through February. Heating degree days against the 10-year normal are the demand forecast; everything else is commentary. A trader who knows the degree-day outlook and the storage deficit already knows most of what the next month of prices will argue about.
LNG Exports: The Demand Revolution
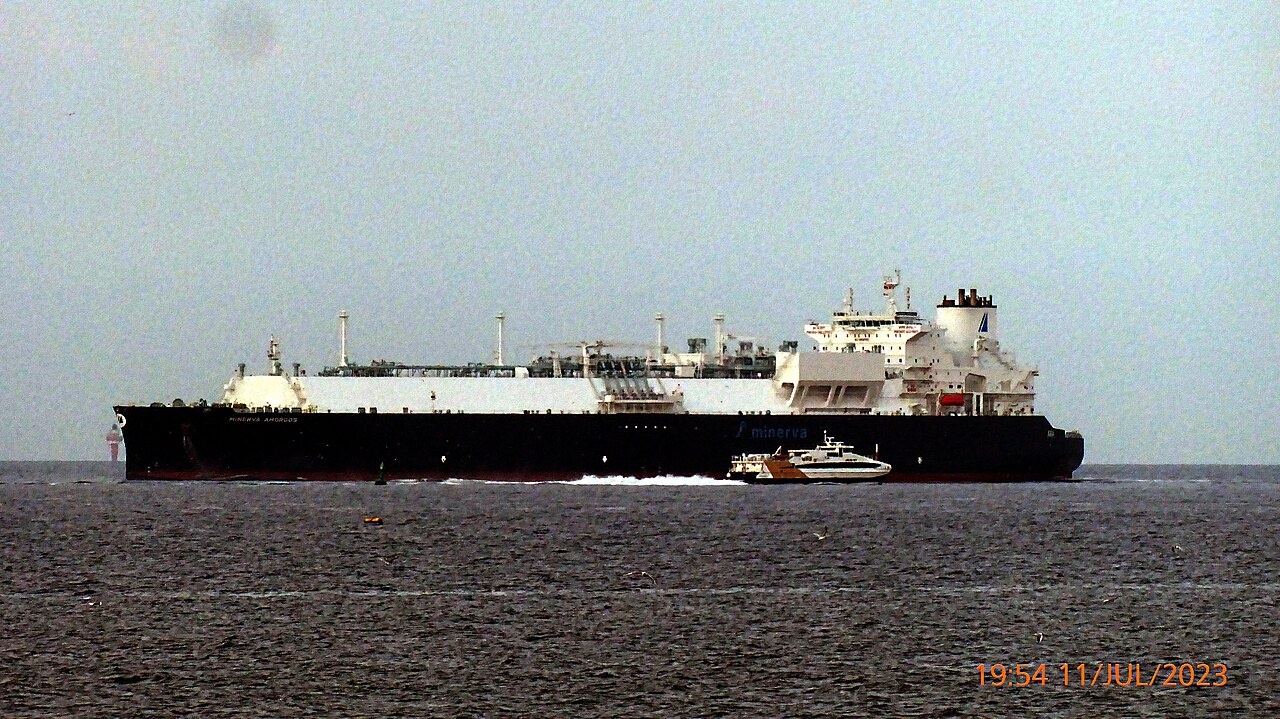
The first LNG cargo left Sabine Pass in February 2016. Less than a decade later, US liquefaction capacity has grown past 15 Bcf/d – Sabine Pass and Corpus Christi (Cheniere), Cameron, Freeport, Cove Point, Calcasieu Pass and Plaquemines (Venture Global), and Golden Pass (QatarEnergy/ExxonMobil) among the projects built or ramping – with a further wave under construction pushing toward 20+ Bcf/d by decade’s end. Feedgas demand that was zero in 2015 now rivals the entire residential sector.
This rewired US price formation in two ways. First, it added a large, steady, price-insensitive demand floor: liquefaction trains run whenever the spread between Henry Hub and world LNG prices exceeds variable costs, which – given that European and Asian gas typically trades at multiples of Henry Hub – is nearly always. Second, it connected Henry Hub to global events. Before LNG, a cold snap in Europe meant nothing to a US gas trader; now it tightens the same Atlantic-basin cargo market US exports feed. Henry Hub remains a domestic benchmark – the mechanics of why are covered in our guide to Henry Hub pricing – but its demand side is now permanently global.
The flip side: export facilities are single points of failure. When an explosion shut the Freeport LNG terminal in June 2022, roughly 2 Bcf/d of demand vanished overnight – and Henry Hub prices fell hard while European prices rose, the same molecule repricing in opposite directions on both sides of the Atlantic. Facility outage headlines are now first-order US gas market events; know your terminals and their feedgas volumes.
Storage: The Market’s Only Shock Absorber
Because gas cannot be stockpiled in tanks at scale, it is stored underground – in depleted fields, salt caverns and aquifers, mostly cycled once a year. Working gas capacity across the Lower 48 is roughly 4,700 Bcf; inventories typically swing from lows around 1,000-1,700 Bcf at winter’s end to peaks near 3,500-3,900 Bcf in early November. That seasonal swing of roughly 2,000+ Bcf is the buffer between a supply system that runs flat and a demand profile that doubles in winter.
The annual rhythm is the market’s heartbeat. Injection season (April-October): demand is soft, production exceeds consumption, and surpluses flow into storage at typically 40-100+ Bcf per week. Withdrawal season (November-March): heating demand outruns production and storage makes up the difference, with draws ranging from trivial in mild weeks to well over 250 Bcf in severe cold – the record weekly draw, set in the January 2018 cold blast, was 359 Bcf. The market judges every weekly figure against the five-year average for that week; the absolute level matters far less than the surplus or deficit to normal and its direction of travel.
One more storage subtlety: the market obsesses over the end-of-October number – the inventory the system carries into winter – and spends the whole injection season trading toward it. A trajectory pointing to 3,900 Bcf by November reads as insurance bought; one pointing to 3,300 reads as a winter with no net underneath it. Autumn prices are, in effect, a running referendum on that single number, updated 30 times by Thursday prints.
Storage is also where gas’s most famous derivatives behavior lives. The March/April futures spread – “the widow-maker” – prices the end-of-winter scarcity question: March is the last withdrawal-season contract, April the first injection-season one. When storage threatens to bottom near tank-empty, March explodes over April; when winter fizzles, the spread collapses. Fortunes and funds (ask Amaranth, 2006) have died trading it, which is the market’s way of saying the inventory math is harder than it looks.
One Benchmark, Many Markets: Basis Risk
Henry Hub – a pipeline junction in Erath, Louisiana – is the settlement point for NYMEX futures, but nobody outside Louisiana consumes gas at Henry Hub. Every physical market prices at a basis differential to it, and those differentials carry their own supply-demand stories. New England, pipeline-constrained, sees winter basis blowouts where Algonquin city-gate gas trades at several times Henry Hub during cold snaps. Appalachian producers routinely sell below Henry because takeaway is scarce. Waha in West Texas goes negative when associated gas overwhelms the pipes. California’s border prices spiked above $50 in late 2022 on pipeline outages and low regional storage while Henry Hub sat under $7.
The point for traders: the national storage number and the NYMEX screen are averages over a continent of bottlenecks. Regional tightness can rage while the benchmark yawns, and vice versa. If you trade futures only, basis is background; if you touch anything physical, basis is the trade.
Reading the Weekly EIA Storage Report
The scoreboard updates every Thursday at 10:30 a.m. Eastern, when the EIA publishes its Weekly Natural Gas Storage Report: total Lower 48 working gas, the weekly injection or withdrawal, comparisons to last year and the five-year average, and a breakdown across five regions – East, Midwest, Mountain, Pacific and South Central, with the South Central figure split between fast-cycling salt caverns and slower non-salt fields. That salt/non-salt detail is worth reading: salt inventories are the market’s rapid-response reserve, and they drain first when the Gulf Coast gets cold or LNG feedgas surges.
Interpreting it is an expectations game. Analysts’ consensus is published in advance, and price reacts to the surprise, not the number. A worked example: consensus calls for a 90 Bcf injection; the print is 68 Bcf. That 22 Bcf miss says the market was tighter than modeled – more power burn, stronger exports, or softer supply – and futures pop within seconds. Whether the pop holds depends on why the miss happened, which the report does not say; the desks that win the next hour are the ones whose supply-demand models already know. A few hard-earned rules: never trade the release itself against the algorithms; treat one week as noise and three consecutive misses in the same direction as signal; and always ask whether a surprise is weather (transient, fades with the forecast) or structural (persistent – an LNG train ramping, a basin rolling over). Weather surprises mean-revert; structural surprises trend.
A Worked Balance: The Arithmetic in One Paragraph
Here is the whole market on the back of an envelope for a hypothetical summer week: dry production 120 Bcf/d, net Canadian imports 5, for 125 of supply. Against it: domestic consumption 75 (power burn heavy, heating nil), LNG feedgas 15, Mexican exports 7 – 97 of demand. Surplus: 28 Bcf/d, call it a 100 Bcf weekly injection after balancing items. If the five-year average injection for that week is 80 Bcf, the market is loosening – bearish, mildly. Now run the same arithmetic with a heat wave adding 5 Bcf/d of power burn and a new LNG train pulling 2 more: the injection drops to ~50 Bcf and the same week reads decisively bullish. Every gas analyst on every desk is doing exactly this arithmetic daily, with better data feeds and the same envelope.
Three Case Studies That Teach the Whole Market
Winter Storm Uri, February 2021
The most violent demonstration of gas fundamentals in modern history. A polar outbreak froze Texas – a state whose wellheads, gathering lines and power plants were not winterized. Demand spiked at the exact moment supply physically froze: production in the state collapsed by several Bcf/d, gas-fired generators failed for lack of fuel, and the grid shed load in the dark. Henry Hub futures barely tell the story; the violence was in physical spot prices, which went from single digits to hundreds of dollars per MMBtu at hubs across the Midcontinent – in some cases north of $1,000 – as utilities paid anything for molecules. Uri’s lessons: gas risk is regional, not national; supply and demand are correlated to the same weather in the worst possible way; and pipeline capacity, not just molecules, is what you are actually short in a crisis.
The 2014 Polar Vortex
The dress rehearsal for Uri, seven years earlier. Repeated Arctic outbreaks drove the largest seasonal storage draw on record – inventories bottomed below 850 Bcf, the lowest in over a decade – and pushed the record 359 Bcf weekly draw’s predecessor benchmarks into the history books. Futures spiked above $6 and Northeast basis went wild, but the systemic damage was modest because supply kept flowing. The market’s takeaway at the time was comforting: shale can outrun any winter. Uri later amended it: shale can outrun any winter that does not freeze the wellheads. Both lessons hold, and the pair of them brackets gas’s winter risk better than any model.
Freeport, June 2022
A single facility explosion removed ~2 Bcf/d of export demand for months. Henry Hub, which had been pricing European desperation, fell roughly 40 percent over the following weeks even as global LNG prices stayed stratospheric. The lesson: in an export-linked market, domestic price is set by the demand the domestic system can actually reach. Infrastructure is the market.
The 2022 European Crisis
Russia’s pipeline cuts sent European gas above the energy-equivalent of $400 crude and dragged Henry Hub to $9-10 – levels unthinkable two years earlier with US production at records. US storage ended that summer below average as exports ran flat out. The lesson: LNG made Henry Hub a partially globalized price, and any analysis that stops at the US border now misses the marginal buyer.
Pipeline Trade: Canada and Mexico
Two quieter flows round out the North American balance, and older commentary chronically understates both. The US imports on the order of 5-6 Bcf/d net from Canada, mostly Western Canadian gas serving the Midwest and Pacific Northwest – flows that matter most in deep winter, when Canadian supply backstops US heating demand. Going the other way, the US exports roughly 6-7 Bcf/d by pipeline to Mexico, feeding power plants and industry that Mexican production cannot supply; that demand grows steadily and rarely makes headlines. Net, the two roughly offset – but they respond to different drivers, and a Canadian cold snap or a new Mexican pipeline commissioning moves the marginal balance in ways a US-only model misses.
Seasonality and the Shape of the Year
The demand calendar gives gas one of the most pronounced seasonal structures in any market: prices and volatility peak December-February, sag through the April-May “shoulder,” firm modestly on summer power burn, then build a risk premium each autumn as the market prices the coming winter’s uncertainty. Traders exploit it through the futures strip – winter contracts trade at persistent premiums to shoulder months, and the whole game is whether realized weather justifies the premium already priced. Systematic approaches – owning winter strength ahead of the season, fading the premium when storage is fat – work until the one winter in five when they very much do not. Seasonality in gas is a loaded distribution, not a guarantee: the average year pays the pattern, the tail year pays whoever respected the tail. Contract mechanics, margining and the practicalities of carrying these positions are covered in our guide to how to trade natural gas futures – each NYMEX Henry Hub contract covers 10,000 MMBtu, so seasonal spread math scales quickly.
The Longer Game: Supply Plateau Meets Demand Growth
The next five years set up an unusual tension. Supply growth faces real friction: Appalachia is pipeline-capped, the Haynesville needs higher prices to grow, base declines across a 120 Bcf/d system are a treadmill measured in tens of Bcf/d of new supply needed annually, and associated gas growth depends on oil markets nobody in gas controls. Demand growth, meanwhile, is the strongest in decades: LNG capacity under construction, pipeline exports to Mexico, and data-center power load all pull the same direction. A market that spent 2015-2024 drowning in supply may spend the late 2020s discovering that $2.50 gas does not fund the drill bit that the demand side requires. That does not guarantee higher prices – this industry has embarrassed every supply pessimist since 2008 – but it does suggest the distribution is shifting, with fatter upside tails than the last decade’s.
Producer behavior adds a final wrinkle. The shale gas industry spent its first fifteen years growing production with borrowed money and destroying shareholder capital; since the early 2020s, investors have demanded discipline – free cash flow, buybacks, restrained drilling. Public producers now talk openly about curtailing gas when prices sag and about not chasing rallies with rigs. If that discipline holds, supply becomes less elastic upward than the 2010s taught everyone to assume, and the market’s response to demand growth falls more heavily on price. If it cracks – and discipline historically cracks about two quarters into any good rally – the old playbook reasserts itself. Watching producer guidance and capex announcements each earnings season is, in effect, watching the supply curve reshape itself in public.
Common Mistakes in Gas Fundamental Analysis
- Trading weather forecasts you saw last. The market reprices within minutes of each model run. If your bullish thesis is “it will be cold,” you are late by definition; the edge is in forecast changes, model disagreement, and demand sensitivity per degree – not the headline map.
- Assuming low prices cut supply quickly. Associated gas, drilled-but-uncompleted well backlogs, and hedged producers keep gas flowing quarters after the price signal says stop.
- Reading national storage as local reality. A comfortable Lower 48 number can hide an empty Pacific region or drained salt caverns – the 2022 California spike happened with national inventories unremarkable.
- Ignoring the export line. Fifteen-plus Bcf/d of LNG feedgas is the swing between glut and balance. An analysis that models domestic demand carefully and treats exports as a constant is modeling the wrong decade.
- Confusing seasonality with certainty. Selling winter premium is profitable most years and catastrophic occasionally. If your strategy’s worst case is “one bad winter,” your strategy is short a tail you have not priced.
- Sizing gas like crude. Henry Hub’s realized volatility routinely runs multiples of WTI’s. Whatever position size feels right from oil experience, halve it, then reconsider.
What a Gas Trader Actually Watches
- The 6-10 and 8-14 day weather models, run twice daily – the highest-frequency demand forecast in any market.
- Thursday’s EIA storage print versus consensus, and the running surplus/deficit to the five-year average.
- Daily production estimates from pipeline nomination data – the fastest read on supply.
- LNG feedgas flows terminal by terminal – the live export demand meter and the first place outages show up.
- Power burn and fuel-switching economics – gas versus coal dispatch spreads.
- Basis markets – Waha, Appalachian and Northeast winter basis tell you where the pipes, not the molecules, are the constraint.
Natural gas supply and demand reward the trader who does the unglamorous arithmetic weekly: production, exports, weather-adjusted demand, storage trajectory. Get the balance right and the violence works for you instead of on you. For the full framework – contracts, strategies, risk management and how fundamentals plug into them – continue with our complete natural gas trading guide.