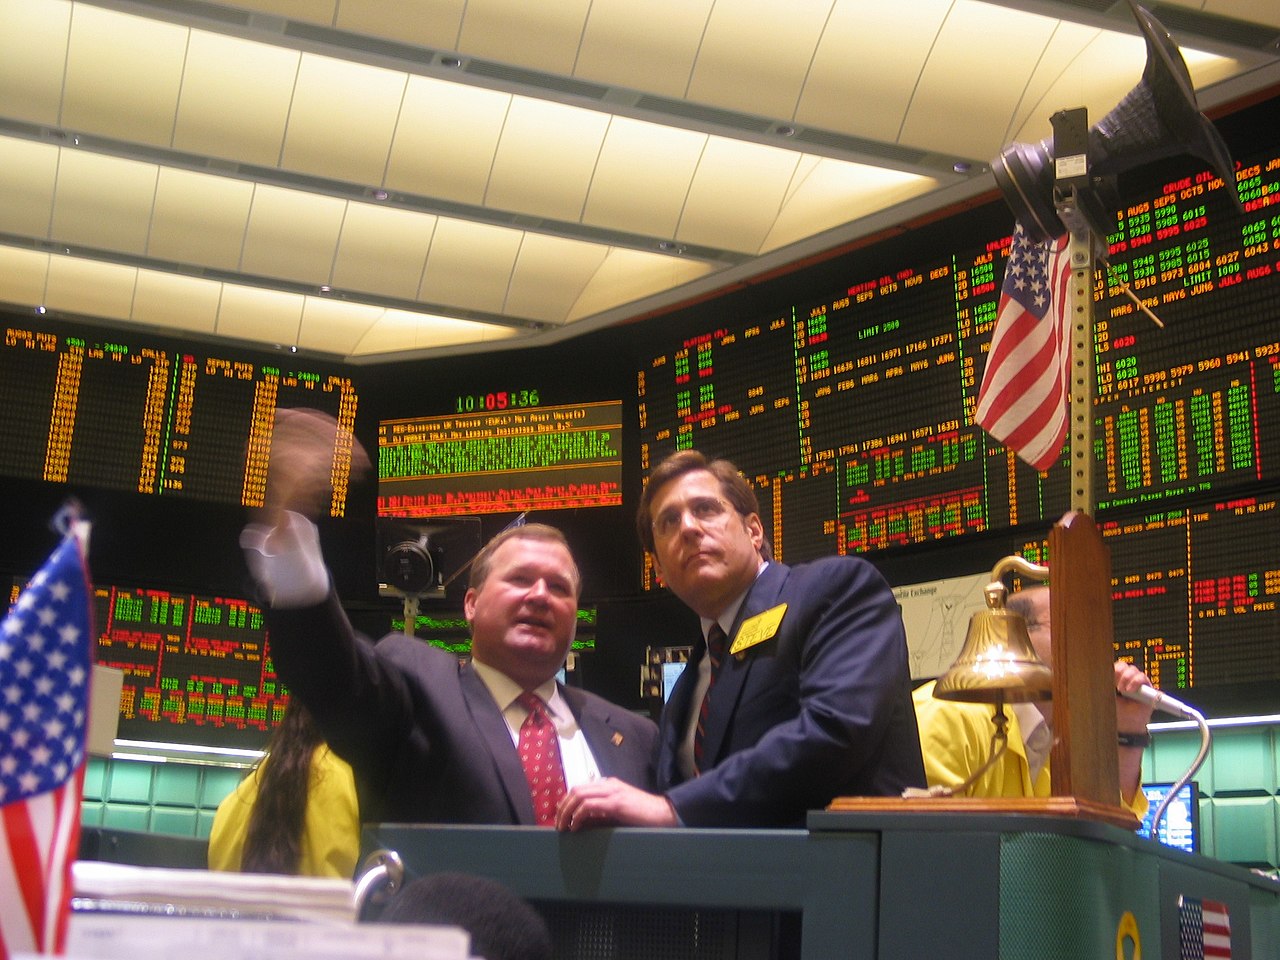
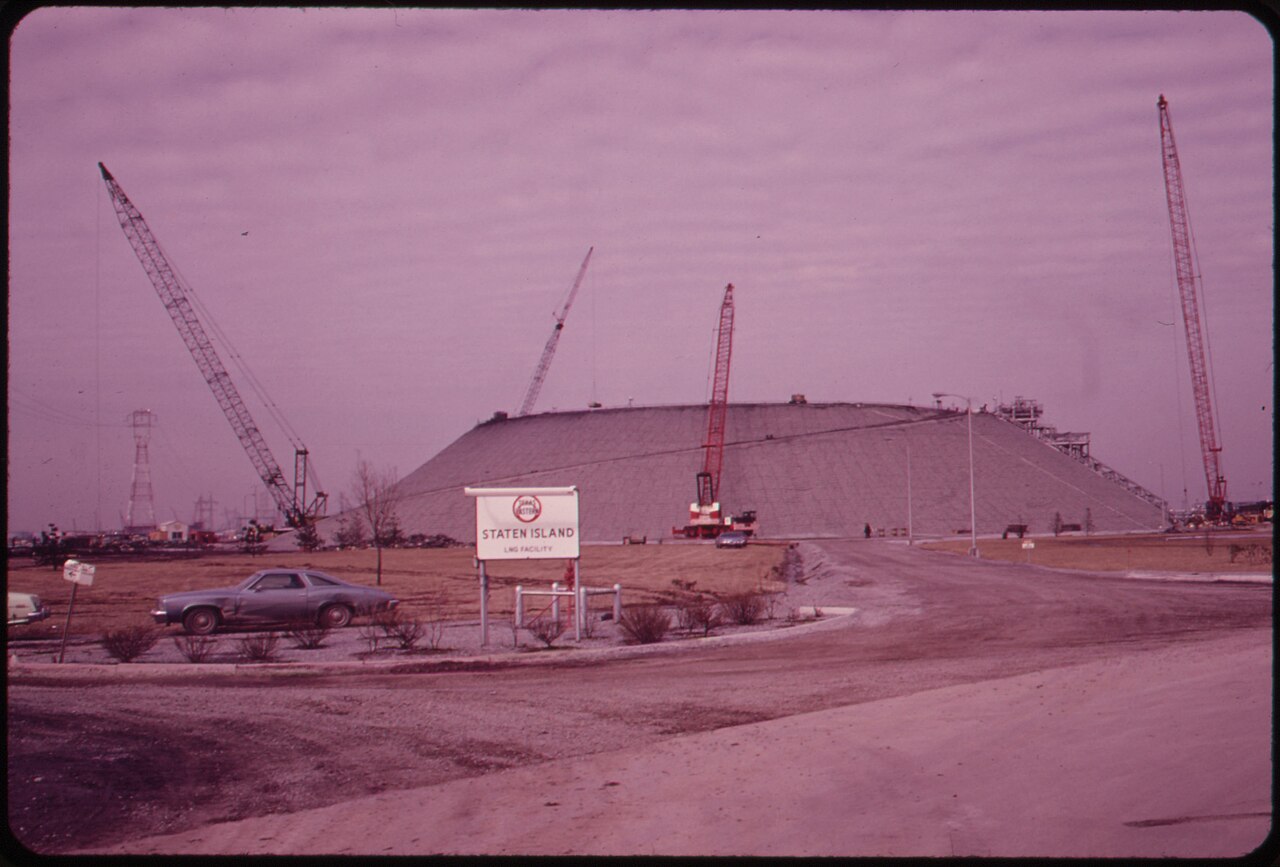
LNG exports are the biggest structural change to Henry Hub pricing since the shale boom itself. Roughly 16 billion cubic feet per day of feedgas demand — about 15% of US production — now leaves the country as liquefied natural gas, tying the US benchmark to European and Asian prices, putting a soft floor under Henry Hub, and turning export terminal outages into some of the sharpest price events in the market.
That changes how you trade the whole complex. The storage-and-weather framework in our natural gas trading guide still applies, but there is now a second demand engine that never sleeps, doesn’t care about degree days, and runs at whatever rate the global LNG market will pay for. If you trade NYMEX gas and you can’t name the terminals, their capacities, and their maintenance schedules, you are trading blind. This article covers the export machine end to end: how feedgas demand works, who buys the gas and on what terms, what the Freeport explosion taught everyone in June 2022, and how the 2026 buildout — Plaquemines, Corpus Christi Stage 3, Golden Pass — feeds through to the Henry Hub benchmark itself.
From zero to 16 Bcf/d in a decade
It is easy to forget how recent all of this is. Ten years ago the United States exported essentially no LNG from the Lower 48. The terminals dotting the Gulf Coast were built in the 2000s as import facilities, back when the consensus said America was running out of gas. Then hydraulic fracturing cracked the Marcellus, Utica, Haynesville and Permian open, production roughly doubled, and the import terminals were reversed at a cost of billions.
Cheniere’s Sabine Pass shipped the first Lower 48 cargo in February 2016. By 2023 the United States had overtaken Qatar and Australia to become the world’s largest LNG exporter. The EIA puts 2025 gross LNG exports at about 15.1 Bcf/d, rising to roughly 16.7 Bcf/d in 2026 as new capacity ramps — a 9% jump in a single year, with another 11% penciled in for 2027. Total US export capacity, about 17 Bcf/d at the end of 2025, should exceed 19 Bcf/d during 2026.
Put that in context: US dry gas production runs a little over 105 Bcf/d. LNG feedgas has gone from a rounding error to the third-largest demand category in ten years, behind only power burn and the combined residential/commercial heating load — and unlike heating demand, it grows every year and never takes the summer off.
How LNG exports pull Henry Hub into the global market
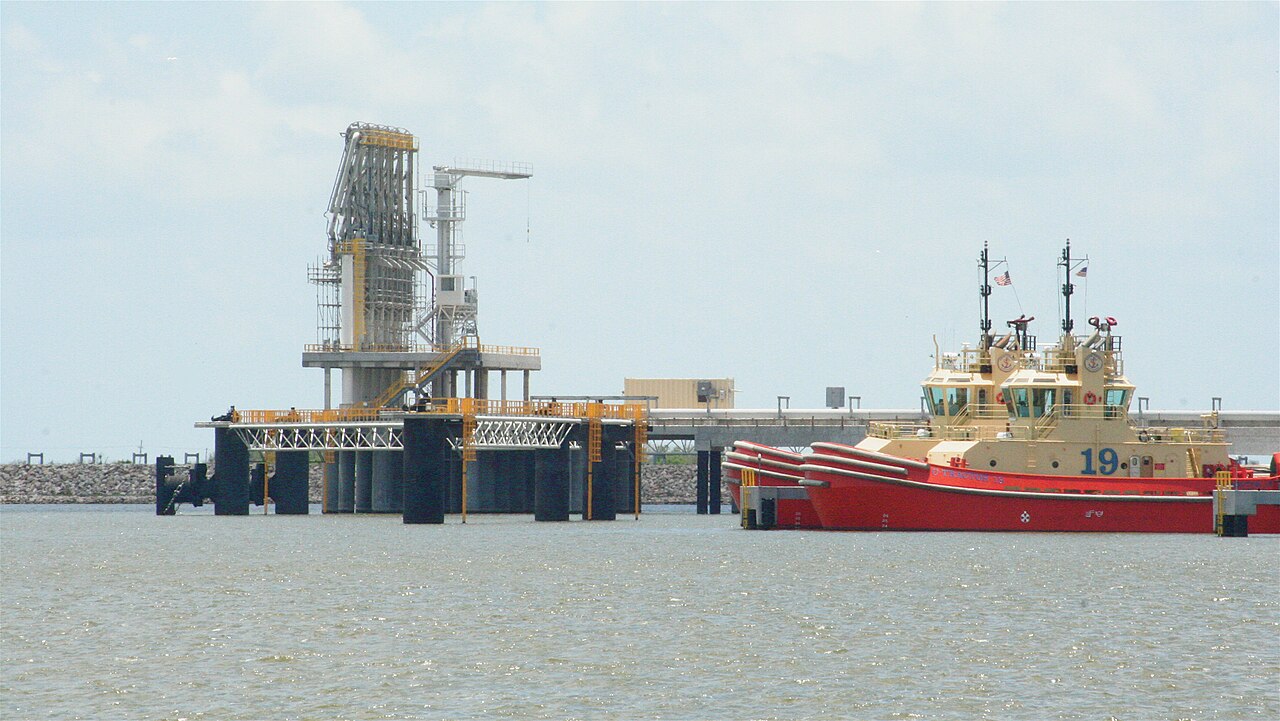
The mechanism is physical and blunt. A liquefaction terminal is a gas consumer like any power plant, just vastly bigger: a single large facility such as Sabine Pass can pull more than 4 Bcf/d of feedgas when all trains run flat out — more gas than most US states consume. Terminals buy that gas from the domestic pipeline grid at prices linked to Henry Hub, chill it to −260°F, and load it onto carriers bound for Europe and Asia.
Feedgas demand shows up in daily pipeline nomination data, which is why it has become one of the most-watched high-frequency indicators on the desk. Traders track aggregate feedgas flows the way they track weather runs: a sudden 1–2 Bcf/d drop in nominations to a specific terminal is often the first public evidence of an outage, hours before any press release. When total feedgas prints a record, that is structural demand tightening the balance; when it sags, several Bcf/d of demand can vanish overnight.
Three consequences follow. First, exports put a soft floor under Henry Hub: as long as European or Asian buyers pay more than the US price plus liquefaction and shipping, terminals run at maximum and absorb marginal supply. Second, they transmit global shocks into a formerly insular market — a cold snap in Seoul or a war scare in the Middle East now shows up in Louisiana. Third, they created a new category of bearish event risk: the export terminal outage, which hands several Bcf/d of gas back to the domestic market with no warning. Each of these deserves its own section.
The terminal fleet in 2026
Nine large-scale export facilities are now operating in the Lower 48, concentrated on the Texas and Louisiana Gulf Coast within pipeline reach of Henry Hub itself. Golden Pass — the ExxonMobil/QatarEnergy joint venture at Sabine Pass, Texas — became the ninth when it shipped its first cargo in early 2026. Approximate capacities below; exact output swings with weather, maintenance and debottlenecking, so treat these as round numbers rather than gospel.
| Terminal | Location | Lead owner/operator | Approx. feedgas capacity | First cargo |
|---|---|---|---|---|
| Sabine Pass | Cameron Parish, LA | Cheniere | ~4.5 Bcf/d | Feb 2016 |
| Corpus Christi (incl. Stage 3) | Corpus Christi, TX | Cheniere | ~2.4 Bcf/d, ramping toward ~3.2 | Dec 2018 |
| Plaquemines | Plaquemines Parish, LA | Venture Global | ramping toward ~2.7 Bcf/d | Dec 2024 |
| Freeport | Freeport, TX | Freeport LNG | ~2.1 Bcf/d | Sep 2019 |
| Golden Pass | Sabine Pass, TX | ExxonMobil / QatarEnergy | ~2.0 Bcf/d nominal (3 trains) | Early 2026 |
| Cameron | Hackberry, LA | Sempra | ~2.0 Bcf/d | May 2019 |
| Calcasieu Pass | Cameron Parish, LA | Venture Global | ~1.6 Bcf/d | Mar 2022 |
| Cove Point | Lusby, MD | Berkshire Hathaway Energy | ~0.8 Bcf/d | Mar 2018 |
| Elba Island | Savannah, GA | Kinder Morgan | ~0.35 Bcf/d | Dec 2019 |
The geography matters. Because almost all of this capacity sits on the western Gulf Coast, LNG demand competes directly with the pipelines that historically moved Gulf gas north and east. That has strengthened Gulf Coast basis relative to Henry Hub and made the South-Central storage region — the one nearest the terminals — the most sensitive to export swings in the weekly EIA data. A longer buildout queue sits behind these nine: FERC, which licenses siting and construction of US LNG terminals, lists several more projects under construction or approved on the FERC LNG dashboard.
Who buys the gas: tolling deals and the 115% formula
Here is the part most price commentary misses: the terminals mostly don’t own the gas they ship. The dominant commercial model, pioneered by Cheniere, is a long-term sale-and-purchase agreement in which the buyer — Shell, TotalEnergies, KOGAS, JERA, a Chinese major — pays roughly 115% of the Henry Hub settlement for the gas itself, plus a fixed liquefaction fee typically in the $2.25–$3.50/MMBtu range. The 15% premium over Hub covers the gas burned as fuel in liquefaction.
Two trading implications. First, the fixed fee is usually take-or-pay: the offtaker owes it whether or not they lift the cargo. That makes US export demand remarkably price-insensitive in the short run — a buyer only cancels a cargo when the variable economics (115% of Henry Hub plus shipping) exceed the destination price, which is rare outside a global glut. It happened in the summer of 2020, when dozens of cargoes were cancelled and feedgas demand collapsed; it has barely happened since. Second, because the commodity leg floats on Henry Hub, foreign buyers hedge on NYMEX. A meaningful slice of open interest in the NG contract — specs at CME Group: 10,000 MMBtu, $0.001/MMBtu tick worth $10 — is now international LNG hedging flow. Henry Hub stopped being a purely domestic price years before most domestic commentary noticed.
The arbitrage: Henry Hub versus TTF and JKM
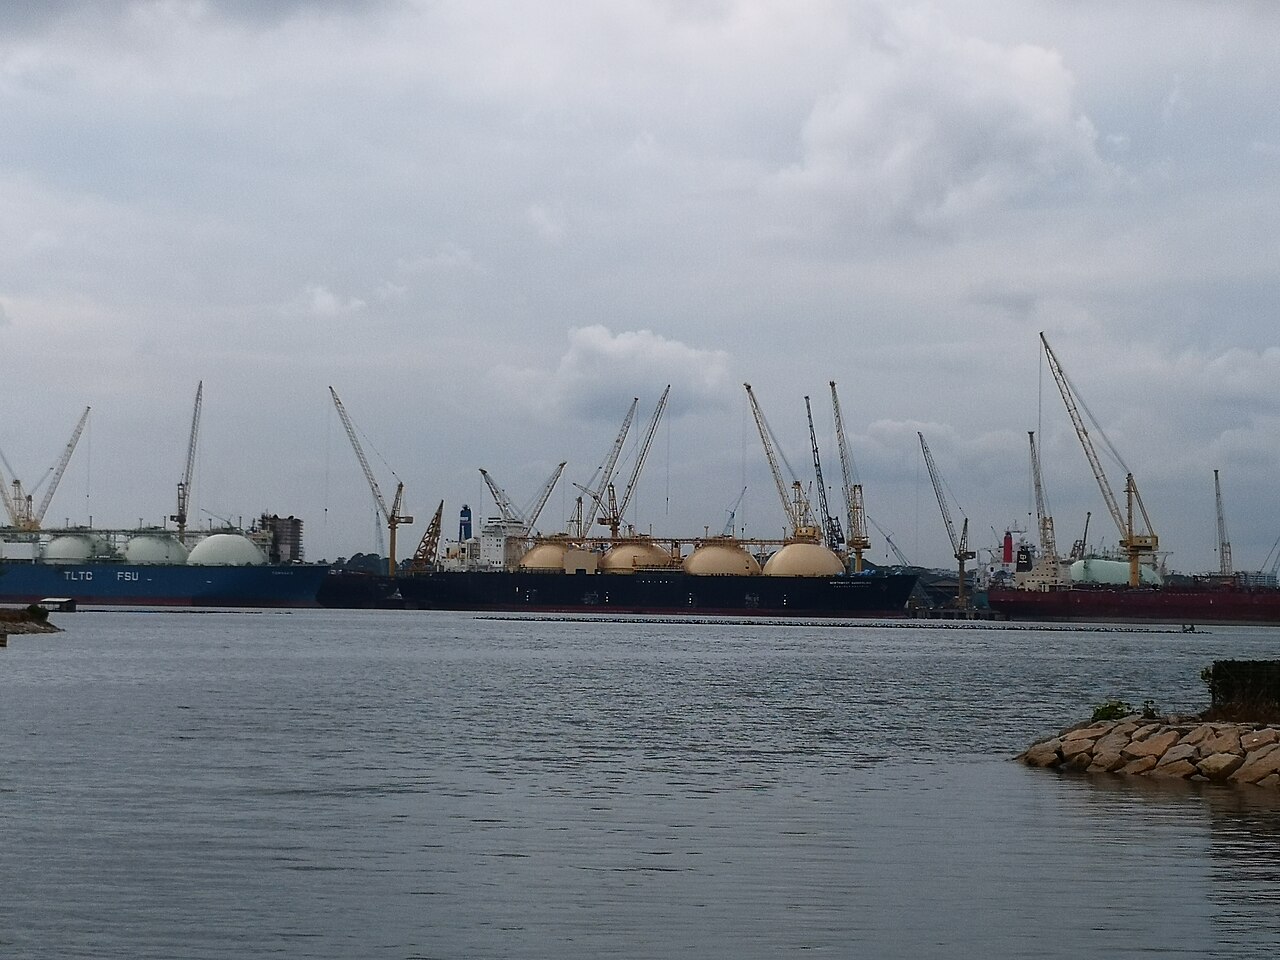
Whether cargoes flow — and how hard terminals run — comes down to a netback calculation any trader can do on a napkin. Take a destination price, subtract shipping and the variable cost of the gas, and see what’s left.
Illustrative math: say Henry Hub trades at $3.50/MMBtu and Northeast Asian spot LNG (the JKM assessment) sits at $12.00. The variable cost of a US cargo is roughly 115% × $3.50 = $4.03 for the gas, plus call it $1.00–$1.50 for shipping depending on charter rates and route. Netback to the Gulf Coast: $12.00 − $4.03 − $1.25 ≈ $6.70/MMBtu of gross margin before the (sunk) tolling fee. At those spreads every train on the coast runs flat out, and it would take a Henry Hub rally past $9–10 to threaten the arb. That is the regime the market has lived in for most of the period since 2021: the arb is so wide that export demand is effectively inelastic, capped by liquefaction capacity rather than price.
The corollary matters just as much: when US capacity is maxed out, a further rally in TTF or JKM does not lift Henry Hub proportionally — there is no additional gas that can leave the continent. The link between US and world prices is real but asymmetric, and it tightens or slackens with spare liquefaction capacity. This is how Henry Hub can sit near $3.50 while Europe pays a multiple of that: the Atlantic doesn’t arbitrage itself; ships and liquefaction trains do. It’s the same logic that keeps WTI and Brent apart when pipeline or export capacity binds, a dynamic we unpack in our comparison of WTI and Brent crude benchmarks.
Do LNG exports raise prices for American consumers?
This is the question that dominates the political debate, and the honest answer is: yes, at the margin — but far less than either side of the argument claims. Basic economics says adding 16 Bcf/d of demand to any market raises the clearing price versus a world without it. Modeling studies of the next wave of export projects have put the incremental effect on domestic prices anywhere from negligible to roughly 10% depending on assumptions, and the range itself tells you how model-dependent the answer is.
What the doom scenarios consistently miss is the supply response. LNG projects take four to six years from final investment decision to first cargo, and they are financed on 20-year offtake contracts. Producers see the demand coming years in advance and drill into it — which is precisely why the export ramp from 2016 to 2019 coincided with some of the lowest Henry Hub prices on record. Appalachian and Haynesville supply growth simply outran the terminals. The counterpoint came in 2022, when post-invasion European demand met a market that couldn’t grow supply fast enough, and Henry Hub spent months above $8. Exports didn’t cause that spike alone, but they transmitted it: without LNG demand, Russian pipeline cuts would have been Europe’s problem and nobody else’s.
The distributional point matters for traders because it drives policy risk. In January 2024 the Biden administration paused new non-FTA export authorizations while the Department of Energy studied price and climate impacts; the pause was lifted a year later under the next administration, and approvals have flowed since. The lesson stands either way: export policy is now a live political variable, and a future permitting freeze — or an emergency export restriction in an extreme winter — is a tail risk the forward curve occasionally has to price. Watch the politics with the same attention you give the pipeline data.
Case study: Freeport, June 8, 2022
If you want the cleanest demonstration of what LNG exports mean for Henry Hub, study Freeport. On June 8, 2022, an explosion and fire shut Freeport LNG’s three-train facility on Quintana Island, Texas — roughly 2 Bcf/d of export capacity, about 17% of US LNG demand at the time, gone in an afternoon. What followed was a textbook demand shock in reverse.
Per EIA data, the Henry Hub spot price fell $1.27/MMBtu the next day, from $9.43 to $8.16, and kept sliding to $6.54 by the end of June as the market digested an extra ~2 Bcf/d looking for a home in domestic storage. US LNG exports averaged 10.1 Bcf/d that June, down 1.5 Bcf/d from May. Meanwhile European TTF prices rose — the same molecules that were bearish for Louisiana were bullish for Rotterdam. One event, two opposite price responses, linked by a ship channel in Texas. The outage, initially pitched as a three-week repair, stretched into 2023.
Now the contract math. NYMEX NG moves $10 per contract per $0.001; a $1.00 move is worth $10,000 per contract. A trader who read the initial feedgas nomination drop correctly and sold two contracts near $8.50 — hypothetically, after the news but before the market fully priced a multi-month outage — and covered at $6.60 as the extended timeline emerged would have booked $1.90 × $10,000 × 2 = $38,000 before costs. The equally instructive losers: everyone who was long gas on the storage-deficit thesis and treated the headline as noise. When a terminal goes down, the balance changes by more than most weather revisions, and it changes for months, not days.
Freeport also permanently rewired hurricane trading. Before exports, a Gulf storm was bullish — it shut offshore production. Today most US supply is onshore shale, while 19 Bcf/d of demand sits on the beach in the hurricane corridor. A storm tracking toward Sabine Pass or Corpus Christi is now a bearish gas headline, a complete inversion of the pre-2016 playbook that still trips up traders who learned the market in the 2000s.
Winter Storm Uri and the other side of the coin
Export risk cuts both ways, and February 2021 showed the bullish version. When Winter Storm Uri froze Texas, the story most people remember is the power crisis and $9,000/MWh electricity. The gas-market subplot: wellheads and gathering lines froze across the Permian and Mid-Continent, several Bcf/d of production disappeared exactly as heating demand went vertical, and Gulf Coast LNG terminals largely shut — not because they wanted to, but because feedgas was being diverted to keep the lights on and pipes pressurized. Regional spot prices in parts of Texas and Oklahoma printed in the hundreds of dollars per MMBtu; Henry Hub itself settled above $20 on the worst days, its highest spot levels in years.
The export-era lesson from Uri is about competition for molecules. In the old market, a domestic freeze rationed demand through price among utilities and industrials. Now there is a third bidder — the global market — standing at the coast with a wide arb. In any future extreme winter, the tension between exporting contracted cargoes and serving domestic load is a genuine physical constraint, and one that state regulators noticed. It is also why winter Henry Hub optionality trades rich: the tail scenarios stack production freeze-offs, record heating demand and export pull on top of each other. Sellers of cheap winter calls in this market are collecting pennies in front of a steamroller that has already run people over twice in five years.
The 2026 setup: three new terminals and a tightening balance
The current wave of capacity is the biggest since the first: Plaquemines LNG ramping toward full rates, Corpus Christi Stage 3 adding trains through the year, and Golden Pass entering service. The EIA’s January 2026 Short-Term Energy Outlook analysis lays out the consequence: supply growth (+1.1 Bcf/d) narrowly outpaces demand growth (+0.6 Bcf/d) in 2026, holding Henry Hub near $3.50/MMBtu on an annual average basis, but the balance flips hard in 2027 — demand up 2.5 Bcf/d against supply up only 0.9 Bcf/d, almost entirely because of LNG feedgas. EIA’s price call: roughly $4.60/MMBtu average in 2027, a 33% jump, as storage inventories slip below the five-year average.
Whether you trust point forecasts or not (we don’t, particularly), the direction of travel is hard to argue with: every incremental train moves the US market closer to a regime where exports, not weather, set the marginal price. Add the geopolitical layer — the 2026 Strait of Hormuz crisis has lifted international LNG prices and pushed buyers toward Atlantic supply, since a meaningful share of global LNG normally transits that strait from Qatar and the UAE — and US terminals are running as hard as maintenance allows. With the arb that wide, the binding constraint is steel, not economics.
Storage, basis, and the new volatility regime
Exports have changed the plumbing beneath the headline price too. Storage now has to balance a bigger, faster market: the same 105 Bcf/d production base must feed peak winter heating and a 16+ Bcf/d export load that doesn’t flinch in January. End-of-season inventory math that looked comfortable in the 2010s gets tight quickly when an extra 1.5 Bcf/d of structural demand shows up year-over-year, which is exactly the setup our guide to natural gas supply and demand walks through in detail.
Regionally, the pull of Gulf Coast liquefaction has flipped historical relationships. Locations that once traded at a discount to Henry Hub for lack of local demand now trade tighter, while far-from-the-coast supply basins wear wider discounts when takeaway is constrained. And volatility is structurally higher: the market’s shock absorbers (storage relative to total demand) are proportionally smaller, while its shock generators (terminals, wars, foreign weather) have multiplied. Realized volatility in NYMEX gas routinely embarrasses crude’s. That is not a defect; for traders it is the product.
The trader’s LNG dashboard
You don’t need a Bloomberg terminal to follow the export layer, though it helps. The data stack, roughly in order of usefulness:
- Daily feedgas nominations. Interstate pipelines post scheduled deliveries to LNG terminals on their public electronic bulletin boards, and several free and paid aggregators total them into a single feedgas number each morning. This is the pulse. Learn what “normal” looks like for each terminal so an anomaly jumps out.
- EIA weekly and monthly data. The weekly natural gas update tracks LNG exports and feedgas alongside the storage numbers, and the LNG monthly reports from the Department of Energy give cargo-level detail with destinations, volumes and prices — slow, but the ground truth everything else gets checked against.
- The foreign benchmarks. Front-month TTF (Dutch gas, the European benchmark) and JKM (Japan-Korea Marker) quotes are the demand side of the arb. You want the spread to Henry Hub, adjusted for the 115% formula and freight, not the absolute level.
- Ship tracking. AIS-based trackers show carriers queuing at terminals. A lengthening queue outside Sabine Pass can mean fog, a loading problem, or a train down — it’s a prompt to dig, not a signal by itself.
- Operator and regulatory filings. Freeport’s restart saga played out in FERC filings, which repeatedly told a slower story than company press releases. When repair timelines matter to your position, read the primary documents.
Sequence matters more than any single source. The typical outage trade unfolds: nomination drop (hour zero) → newswire headline (hours later) → operator statement (day one, optimistic) → regulatory filings (weeks, realistic) → restart (later than promised). Each stage reprices the curve, and the later stages are where preparation beats speed.
Trading the export era: a practical playbook
Some desk-level rules for trading LNG-driven moves in Henry Hub futures — mechanics of order types, margin and rolls are covered in our guide to trading natural gas futures:
- Watch feedgas nominations daily. Aggregate LNG feedgas is the single best real-time read on export demand. A drop of more than ~1 Bcf/d concentrated at one terminal is an outage until proven otherwise. The move usually isn’t fully priced in the first hour.
- Know the maintenance calendar. Terminals take planned turnarounds, typically in shoulder season. Confusing scheduled maintenance with an unplanned outage is a classic way to sell a hole.
- Size outage trades for months, not days. Freeport taught the market that “three weeks” can mean eight months. Initial repair estimates from operators are marketing, not engineering.
- Respect the asymmetry. Terminal outages are reliably bearish (domestic oversupply); foreign price spikes are only mildly bullish when US capacity is already maxed. Don’t buy Henry Hub on a JKM headline without checking spare liquefaction capacity first.
- Track the ramp schedules. New trains (Plaquemines, Corpus Stage 3, Golden Pass) add demand in discrete steps. Commissioning feedgas often shows up weeks before first cargo — bullish at the margin and visible in the nomination data if you’re looking.
- Trade the calendar structure, not just flat price. The 2027 tightening story lives in calendar spreads and the winter strip more than in the front month, where weather noise dominates. If you believe the EIA’s feedgas math, the cleaner expression is owning deferred winters against nearby contracts — with the caveat that the whole curve already knows this story.
One honest warning: LNG headlines are now a crowded trade. Algorithmic feeds parse nomination data and operator filings in milliseconds, and the easy money in the first minutes of an outage headline mostly belongs to machines. The retail edge, such as it is, lies in the second-order trade — correctly judging outage duration, storage feedback and curve shape over weeks, where patience still beats latency.
Does Henry Hub set global LNG prices?
Not yet — but its gravitational pull grows every year. Global LNG still prices off three families of benchmarks: oil-indexed contracts (the legacy Asian model, typically a percentage of Brent), European hub prices led by TTF, and spot Asian assessments led by JKM. Henry Hub’s role is different: it is the cost floor of the marginal supplier. With the US now shipping roughly a quarter of the world’s LNG, the long-run price of gas delivered to Europe or Asia cannot sit below 115% of Henry Hub plus liquefaction and freight for long — that’s the level at which US supply stops flowing and the market tightens until it doesn’t.
That gives US gas traders something they never had before 2016: a structural reason for foreign money to care about their benchmark. New long-term supply deals signed by Asian and European buyers increasingly embed Henry Hub indexation directly, which means utilities in Tokyo and traders in Geneva now carry NYMEX exposure as a matter of course. The futures curve, the options surface and the physical basis market around the Hub all deepen as a result. Benchmarks earn their status from liquidity and trust, the same way WTI and Brent did in crude — and by both measures Henry Hub is the only gas price in the world gaining share.
The practical read for a US-focused trader: watch what the marginal foreign buyer is doing, because their contracting behavior sets how much of the 2027-2030 export wave is already sold. A wave of new Henry Hub-indexed offtake deals is a multi-year bullish signal for the Hub — committed future feedgas demand — even when it does nothing to tomorrow’s price.
The bottom line
LNG exports turned Henry Hub from a continental price into the anchor of the global gas market — and turned nine industrial facilities on the Gulf Coast into the most important demand variable in North American energy. The floor under prices, the transmission of foreign shocks, the inverted hurricane playbook and the 2027 tightening path all trace back to the same 19 Bcf/d of liquefaction steel. Master the export layer alongside storage and weather — the full framework is in our complete natural gas trading guide — and the contract specs and curve mechanics in our primer on natural gas futures contracts, and you have the three pillars of the modern gas market. Ignore any one of them and the market will eventually explain it to you the expensive way.