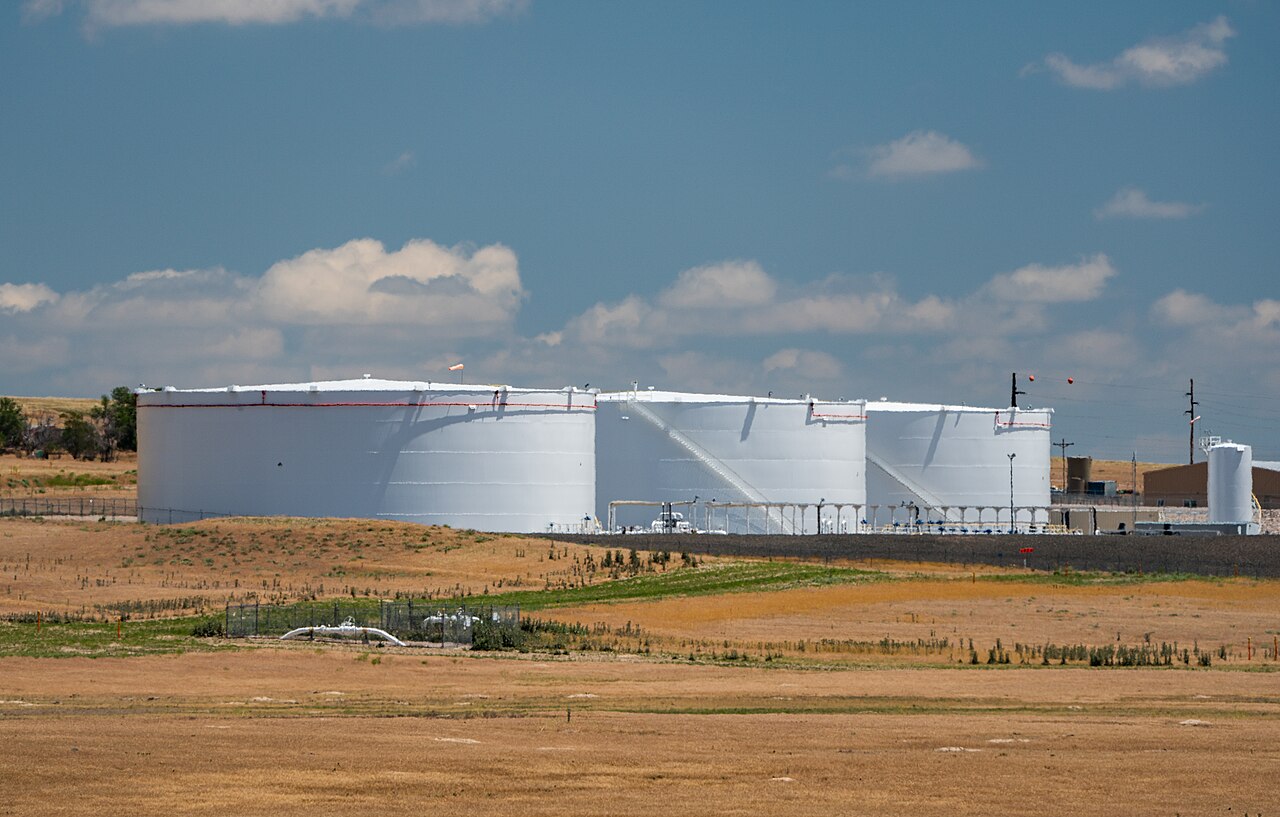
Ask two oil traders which contract they trade and you have learned most of what you need to know about them. WTI vs Brent is not just a quiz question about API gravity – it is the dividing line between two different markets. WTI prices the barrel sitting in a tank in Oklahoma. Brent prices the barrel on a ship, and by extension most of the crude that changes hands anywhere on earth. The two usually move together. The interesting trades happen when they don’t.
This article digs into how the benchmarks differ in practice: the physical specs, the contract mechanics, the logistics behind each price, and how professionals trade the spread between them. If you are still getting oriented in the oil market generally, start with our complete guide to crude oil trading and come back – this piece assumes you know what a futures contract is.
WTI: The Landlocked American Benchmark
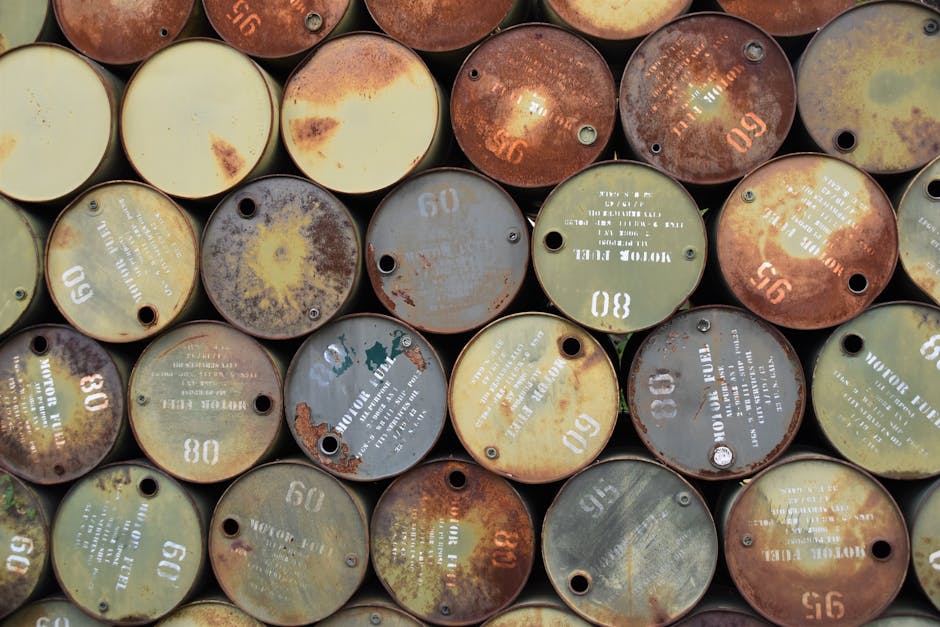
West Texas Intermediate is light, sweet crude from US onshore fields – today that overwhelmingly means the Permian Basin. The reference specs are an API gravity of roughly 39.6 degrees and sulfur content around 0.24%, which makes WTI one of the highest-quality crudes traded in size anywhere. Light and sweet means it yields a lot of gasoline and diesel without expensive desulfurization, so refiners built for light crude pay up for it.
The futures contract is NYMEX CL, listed on CME Group: 1,000 barrels per contract, physically delivered at Cushing, Oklahoma. It is the most liquid crude oil contract in the world – front-month volume routinely exceeds a million contracts a day – and the full contract specifications are on CME’s site. If you want the mechanics of margin, expiry, and rollover, we cover them step by step in our guide to how to trade crude oil futures.
The word that matters most for WTI is landlocked. Cushing is a tank farm in the middle of Oklahoma with roughly 90 million barrels of shell capacity, fed by pipelines like Basin (from the Permian) and Keystone (from Alberta), and drained by outbound lines to the Gulf Coast – Seaway and the MarketLink extension being the big ones. One clarification worth making, because it gets repeated incorrectly: the Colonial Pipeline has nothing to do with Cushing. Colonial moves refined products – gasoline, diesel, jet – from the Gulf Coast to the East Coast. Cushing’s plumbing is crude-only.
Because every WTI futures contract ultimately settles into a tank at this one location, the state of Cushing’s storage – how full it is, how fast barrels are flowing in and out – feeds directly into the WTI price in a way that has no parallel for Brent.
Brent: The Seaborne Global Benchmark
Brent started life as crude from a single North Sea field, discovered in 1971 and now almost entirely decommissioned. As production from the original field declined, the benchmark evolved into a basket of comparable North Sea streams – Brent, Forties, Oseberg, Ekofisk, and Troll – and in June 2023 the price reporting agencies added WTI Midland, the export-grade American barrel, to keep the assessment liquid. That change quietly acknowledged something traders already knew: US crude now anchors the Atlantic basin’s marginal supply.
Quality-wise, the Brent blend runs around 38 degrees API with sulfur near 0.4% – still light and sweet, just a shade heavier and more sulfurous than WTI. The futures contract trades on ICE under the symbol B (some brokers display proprietary codes, but B is the exchange symbol), 1,000 barrels per contract. Here is the structural difference that trips people up: ICE Brent futures are cash-settled against the ICE Brent Index, which is built from physical cargo trading in the North Sea market. Nobody takes delivery of a tanker by holding an ICE Brent future to expiry. WTI is a physical-delivery contract; Brent is a financial contract tied to a physical assessment. That single design choice explains a lot of the behavioral differences between the two.
Brent’s claim to fame is reach. Because North Sea (and now US export) barrels load onto ships that can sail anywhere, Brent became the natural reference for seaborne crude – and today somewhere between two-thirds and 80% of internationally traded crude is priced off Brent or Brent-linked formulas, depending on how you count. Nigerian grades, Caspian grades, and much of the Atlantic basin price as differentials to Dated Brent. For the full map of how the world’s reference grades fit together, see our guide to crude oil benchmarks.
WTI vs Brent: The Numbers Side by Side
| Feature | WTI | Brent |
|---|---|---|
| API gravity | ~39.6° (lighter) | ~38° |
| Sulfur content | ~0.24% (sweeter) | ~0.4% |
| Exchange / symbol | NYMEX (CME) / CL | ICE / B |
| Contract size | 1,000 barrels | 1,000 barrels |
| Settlement | Physical delivery at Cushing, Oklahoma | Cash-settled vs ICE Brent Index |
| Supply base | US onshore (Permian, Eagle Ford, Bakken) | North Sea streams plus WTI Midland |
| Price anchor | US inland supply-demand, Cushing stocks | Seaborne Atlantic basin, global trade |
| What prices off it | US domestic grades, US export formulas | Most internationally traded crude |
Notice what the table does not show: a meaningful quality gap. Both are light, sweet crudes. Pre-2011 the two prices rarely strayed more than a couple of dollars apart, and the difference was mostly freight. What separates them now is geography and logistics, not chemistry.
Where the Two Benchmarks Came From
Neither benchmark was designed by a committee; both were accidents of infrastructure. Cushing became the center of American oil pricing because of a gusher field discovered there in 1912. The oil ran out, but the pipes, tanks, and trading relationships stayed, and by the time NYMEX launched the WTI futures contract in 1983, Cushing was the natural delivery point – the one place where enough pipelines crossed that a delivered barrel could actually go somewhere. The contract worked because the plumbing already existed.
Brent’s rise was similarly practical. When the North Sea opened up in the 1970s, its crude loaded onto ships in a politically stable jurisdiction with clear legal title and published loading schedules – a rare combination at the time. A forward physical market (“15-day Brent”) grew up among equity producers and traders in the early 1980s, and London’s International Petroleum Exchange listed a Brent futures contract in 1988. ICE acquired the IPE in 2001 and eventually took the contract fully electronic. The lesson buried in both stories: benchmarks are not chosen for the quality of the oil. They emerge where logistics, law, and liquidity happen to line up – and they persist long after the original oil is gone, as Brent proves, since the Brent field itself has been shut down and dismantled while its name still prices half the world’s crude.
Expiry mechanics: the delivery machine vs the index
The two contracts also die differently each month, and serious traders need to know how. WTI trading terminates around the 20th of the month prior to delivery; anyone still long at termination is on the hook to receive 1,000 barrels per contract at Cushing, ratably over the delivery month, via pipeline or in-tank transfer. In practice almost everyone rolls or exits well before – open interest migrates to the next month in the week ahead of expiry, and retail brokers typically force-close positions rather than let clients stumble into delivery.
ICE Brent instead cash-settles: on expiry day, the exchange publishes the ICE Brent Index – an average built from actual and reported cargo trades in the BFOET-plus-Midland physical market – and open positions are marked to that number and closed with a cash payment. No tanks, no tankers, no delivery notices. The subtlety is that the futures price converges toward a physical assessment (Dated Brent and the related forward market) rather than toward a warehouse receipt, which is why physical North Sea trading activity in the pricing window gets such disproportionate scrutiny from regulators and price reporting agencies alike.
The Brent-WTI Spread: A Short History of a Famous Trade
The difference between the two prices – Brent minus WTI – is one of the most traded relationships in commodities. There is no special ticker for it; it is simply the Brent-WTI spread, and on physical desks you will hear it called “the Arb,” because it tracks the arbitrage economics of moving a US barrel onto the water to compete with Brent.
How the spread blew out, then healed
For decades WTI actually tended to trade slightly above Brent – marginally better quality, and the US was the premium demand market. Then shale happened. From 2011 through 2013, surging US production piled into Cushing faster than pipelines could move it out, while the Libyan civil war was simultaneously removing light sweet barrels from the Brent complex. The spread exploded to more than $25 per barrel at its 2011 extremes. Same quality of oil, $25 apart, purely because one barrel was stuck in Oklahoma and the other was on a ship.
The market fixed it the way it always does: infrastructure. The Seaway pipeline was reversed in 2012 to flow from Cushing to the Gulf Coast instead of the other way, more takeaway capacity followed, and in December 2015 Washington lifted the 40-year-old ban on US crude exports. Once American barrels could reach the water freely, the spread compressed to the low single digits – typically $2 to $6 – where it has spent most of its time since. The June 2023 inclusion of WTI Midland in the Brent basket tied the two benchmarks together even more tightly: American crude is now literally inside the Brent price.
What moves the spread today
Four things, mostly. Cushing inventories – builds cheapen WTI relative to Brent, draws do the opposite. US production growth versus takeaway capacity. Freight rates, since the arb is net of shipping costs. And geopolitics with an asymmetric footprint: a supply scare in the Middle East or a North Sea outage hits Brent harder, while a US-centric event – a hurricane shutting Gulf Coast ports, an SPR release – moves the WTI leg. The December 2017 Forties pipeline shutdown was a clean example: one cracked pipe in Scotland spiked Brent against WTI within hours. More recently, the Middle East tensions of spring 2026 whipsawed the spread again as traders repriced seaborne supply risk – a reminder that the spread is, among other things, a live gauge of geopolitical anxiety.
Trading it in practice
A spread trade means buying one benchmark and selling the other, in equal contract counts. Long Brent / short WTI profits if Brent’s premium widens; short Brent / long WTI profits if it compresses. Say the spread is $3.50 and you think Cushing draws will tighten WTI: you buy one CL, sell one ICE Brent. If the spread narrows to $2.00, you make $1.50 x 1,000 barrels = $1,500 per spread, regardless of whether flat price went up or down $5 along the way. That directional neutrality is the appeal. The danger is treating it as low-risk: spread moves can be violent precisely when logistics break, and margin offsets tempt traders into oversizing. A $25 blowout has happened once already this century.
Reading the spread like a physical trader
The cleanest way to think about the fair value of the Brent-WTI spread is as an export arbitrage. A barrel of WTI Midland bought in West Texas has to pay pipeline tariff to the Houston area (call it $1 and change per barrel, depending on the line and commitment), terminal fees, and then freight across the Atlantic – often another $1.50 to $3.00 depending on tanker rates. Add it up and a Gulf Coast exporter needs Brent to sit roughly $2.50 to $4.50 above inland WTI before shipping a cargo to Europe makes money. When the quoted spread trades wider than that all-in cost, exports surge, Cushing and Gulf Coast stocks draw, and the spread compresses back. When it trades narrower, cargoes stay home and the spread eventually widens again.
That is the gravitational logic – but note the word eventually. Freight rates spike, pipelines fill, export terminals hit capacity, and the spread can sit outside its theoretical band for months when logistics genuinely bind. The traders who make consistent money on the Arb are usually the ones watching tanker fixtures and pipeline nominations, not the ones drawing Bollinger Bands on the spread chart.
Storage, Contango, and the Cushing Problem
Because WTI physically delivers into Cushing, the futures curve responds directly to how full those tanks are – and this is where a lot of published commentary gets the terminology backwards, so let’s be precise. When Cushing inventories are high, the near-month contract trades at a discount to later months. That curve shape is called contango. It is the market paying you to store oil: buy the cheap prompt barrel, put it in a tank, sell a deferred future against it, and collect the difference. When inventories are tight, the prompt barrel commands a premium over deferred months – that is backwardation, and it signals the market bidding urgently for oil now. High stocks mean contango, not backwardation. If you remember one piece of curve vocabulary, make it that one.
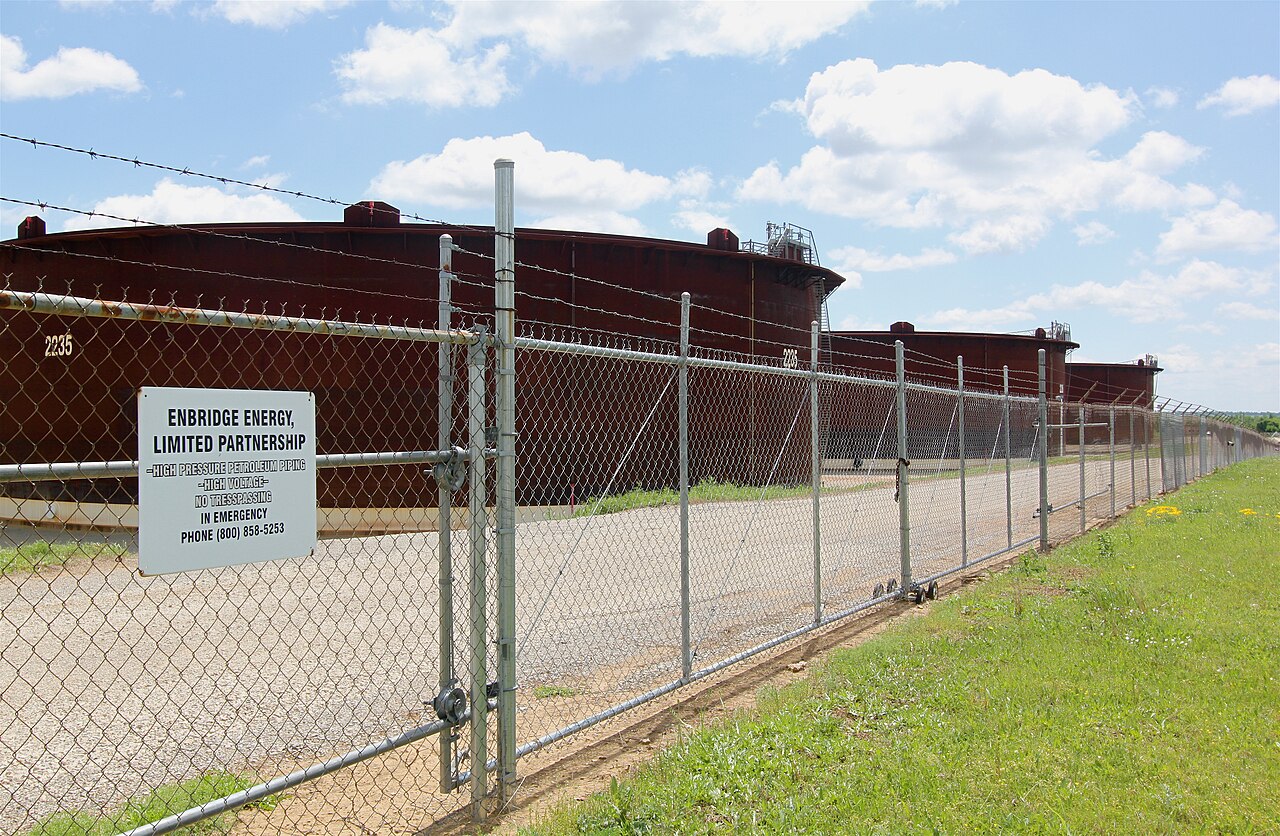
April 2020 showed what happens at the limit. Demand had collapsed under COVID lockdowns, Cushing was effectively booked full, and holders of the expiring May WTI contract faced taking delivery of oil with nowhere to put it. On April 20, 2020, the May contract settled at minus $37.63 per barrel – sellers paying buyers to take oil off their hands – while the June contract still traded around $20. That grotesque front spread was super-contango in its purest form, and it was a WTI-specific event. Brent, cash-settled and tied to seaborne barrels that can float on ships, fell hard that month but never went negative. If you want proof that contract design matters, there it is.
What Moves Each Benchmark Day to Day
WTI dances to an American drumbeat. The EIA’s Weekly Petroleum Status Report, out Wednesdays at 10:30 a.m. ET, is the biggest scheduled event of the week – and within it, the Cushing line item punches far above its weight for WTI specifically. Beyond the weekly data: US shale production trends, refinery runs and turnaround seasons, hurricane risk in the Gulf of Mexico, and Strategic Petroleum Reserve policy, which stopped being theoretical after the 180-million-barrel release of 2022.
Brent answers to the wider world: OPEC+ supply decisions above all, North Sea maintenance season (loading programs shrink every summer), Russian export flows, Atlantic basin refinery demand, and tanker economics. Chokepoint risk lands on Brent first – roughly a fifth of the world’s petroleum moves through the Strait of Hormuz, and while Gulf grades are not Brent, the fear trade prices through the global benchmark. We cover how the cartel’s decisions transmit into flat price in how OPEC controls oil prices.
The American Petroleum Institute’s inventory survey lands Tuesday evenings as a preview of the EIA number, and Baker Hughes rig counts round out the week on Fridays. Brent traders watch a softer-edged calendar: OPEC+ meeting dates, the monthly OPEC and IEA market reports, and North Sea loading programs that circulate among physical players. Neither calendar is optional – a surprising number of “mystery” intraday moves are just someone else’s scheduled data point you forgot about.
One practical consequence: WTI concentrates its liquidity and volatility in US hours, while Brent’s flows are spread more evenly around the clock. If you trade from Asia or Europe, Brent’s session profile may simply fit your day better.
Quality, Refineries, and Who Actually Buys What
Here is a nuance the spec sheets miss. On paper WTI is the premium barrel – lighter, sweeter, higher gasoline yield. In practice, the most sophisticated refining complex on earth, the US Gulf Coast, spent decades investing in cokers and hydrotreaters to process heavy, sour crude at a discount. Many of those refiners do not particularly want more light sweet shale oil; the margin is in upgrading cheap difficult barrels. That mismatch is exactly why so much light US crude gets exported and priced into the Brent complex rather than refined at home, and why quality differentials between grades – sweet versus sour, light versus heavy – are a market of their own.

Sulfur is the other axis. Both benchmarks sit comfortably in sweet territory (under 0.5% sulfur), but genuinely sour grades like Arab Heavy carry several dollars of discount because removing sulfur costs real money. When OPEC+ cuts production, it typically removes medium-sour barrels from the market, which tightens the sweet-sour spread and shifts relative demand between the benchmarks’ pricing families.
Benchmarks exist to concentrate liquidity in one trustworthy reference – it is the same logic that makes US natural gas trade against Henry Hub pricing rather than a hundred local hubs. The benchmark barrel is rarely the barrel you actually own; it is the yardstick you hedge against.
Common Mistakes When Trading WTI vs Brent
Assuming the spread always mean-reverts. It usually does – until the market’s structure changes underneath you. Traders who shorted the Brent premium at $8 in 2011 on “reversion” watched it triple. The spread reverts to its logistics cost, and that cost itself moves when pipelines open, export bans lift, or benchmarks get redefined. Know which regime you are in before you fade an extreme.
Confusing curve shape with direction. Contango is not “bearish tomorrow” and backwardation is not “bullish tomorrow” – they describe the price of time and storage, not a forecast. Plenty of rallies have started in deep contango (April 2020, from minus $37) and plenty of selloffs in steep backwardation (mid-2022). Trade the curve as its own signal, separately from flat price.
Ignoring the calendar mismatch. WTI and Brent expire on different dates and their front months can reference different delivery periods late in the cycle. A “front-month spread” position held into WTI expiry week quietly becomes a different trade. Professionals trade the spread in matched calendar months and roll both legs together.
Oversizing because it feels hedged. Two legs do not mean half the risk. Exchange margin offsets on the spread are generous precisely because the legs are correlated 0.9-plus most of the time – but the losses come in the small minority of days when that correlation snaps, and those are exactly the days everything else in your book is misbehaving too.
Trading the EIA number in the spread. Wednesday’s inventory print moves WTI within seconds; the spread’s reaction is faster than any retail platform. If your plan is to react to the headline Cushing number, you are the liquidity, not the trader.
Which One Should You Trade?
For most short-term traders, WTI. The liquidity is unmatched, spreads are a tick wide in the front month, and the micro-sized contracts (Micro WTI, 100 barrels) let you size positions sanely while you learn. The catch is the overnight gap risk if you only trade US hours – oil news does not wait for New York to open.
Trade Brent if your edge is global – OPEC+ politics, tanker flows, Asian demand – or if your trading day lives in London or Singapore time. Brent’s cash settlement also removes any theoretical delivery risk from holding too close to expiry, though letting a position ride into expiry week is sloppy practice in either contract.
Hedgers should simply match the benchmark to the exposure. A Permian producer’s realized price lives in the WTI complex; a European refiner buying Atlantic basin cargoes lives in Brent. Hedging one against the other leaves you long or short the spread without meaning to be – which is a position, whether you wanted one or not.
And if you find yourself with a view on the relationship rather than the direction – Cushing filling up while the Atlantic tightens, or vice versa – the spread itself is the instrument. Just respect it: it is a logistics trade wearing a financial costume.
One last wrinkle worth knowing: “WTI” is really a family, not a single price. WTI at Cushing is the futures benchmark, but physical traders also quote WTI Midland (at the wellhead end of the Permian) and WTI Houston (at the export terminals), each carrying its own differential to the NYMEX price. When pipeline space from the Permian gets tight, Midland barrels trade dollars under Cushing; when export demand runs hot, Houston trades over. Those differentials are the fine-grained readout of the same logistics story the Brent-WTI spread tells at continental scale.
The Bottom Line
WTI and Brent are chemically similar crudes attached to completely different delivery machines. WTI is a physically settled contract chained to tank space in Oklahoma; Brent is a cash-settled contract tracking the seaborne market that prices most of the world’s oil. Their spread is a live readout of American logistics versus global supply risk – occasionally boring, periodically spectacular.
Learn both, even if you only trade one. The relationship between them tells you things neither price tells you alone. For the broader framework – instruments, fundamentals, risk management, and how benchmark selection fits into an actual trading plan – go back to our crude oil trading guide, or drill into futures mechanics next.