There are hundreds of distinct crude oil grades in commercial production – Bonny Light, Urals, Arab Heavy, Maya, WCS, Murban, and on and on. Almost none of them has its own liquid futures market. Instead, nearly every barrel on earth is priced as a premium or discount to a handful of crude oil benchmarks: WTI, Brent, and the Dubai/Oman complex. Master how those references work and the entire global pricing system snaps into focus. Skip it, and half of what you read about oil prices will quietly mislead you.
This piece is the reference-grade map: what each benchmark is, who prices against it, how the assessments are actually built, and where the traps are. It pairs with our complete guide to crude oil trading, which covers the instruments and strategy side of the market.
Why Crude Oil Benchmarks Exist at All
Crude is not fungible. A barrel of 45-degree Malaysian Tapis and a barrel of 20-degree Canadian heavy are both “oil” the way a racehorse and a plow horse are both horses. Density and sulfur content determine what a refinery can make from a barrel and what it costs to make it, so different crudes are genuinely worth different amounts – and those relative values shift with product demand and refinery configuration.
A market with hundreds of grades and no common reference would be chaos: every cargo negotiation starting from zero. Benchmarks solve this. Concentrate hedging and speculation in a few deeply liquid reference prices, then trade every physical grade as a differential – Bonny Light at Dated Brent plus a dollar and change, Arab Heavy at its benchmark minus several dollars. The buyer and seller only need to negotiate the differential, which moves in cents, while the benchmark handles the dollars. It is an elegant system, and it means the “oil price” you see on television is really the price of one very specific barrel in one very specific place.
Three pricing families dominate. WTI anchors North America. Brent anchors the Atlantic basin and, by convention, most of the world. Dubai and Oman anchor Middle East exports heading to Asia – the largest physical trade flow in the market.
WTI: The North American Anchor
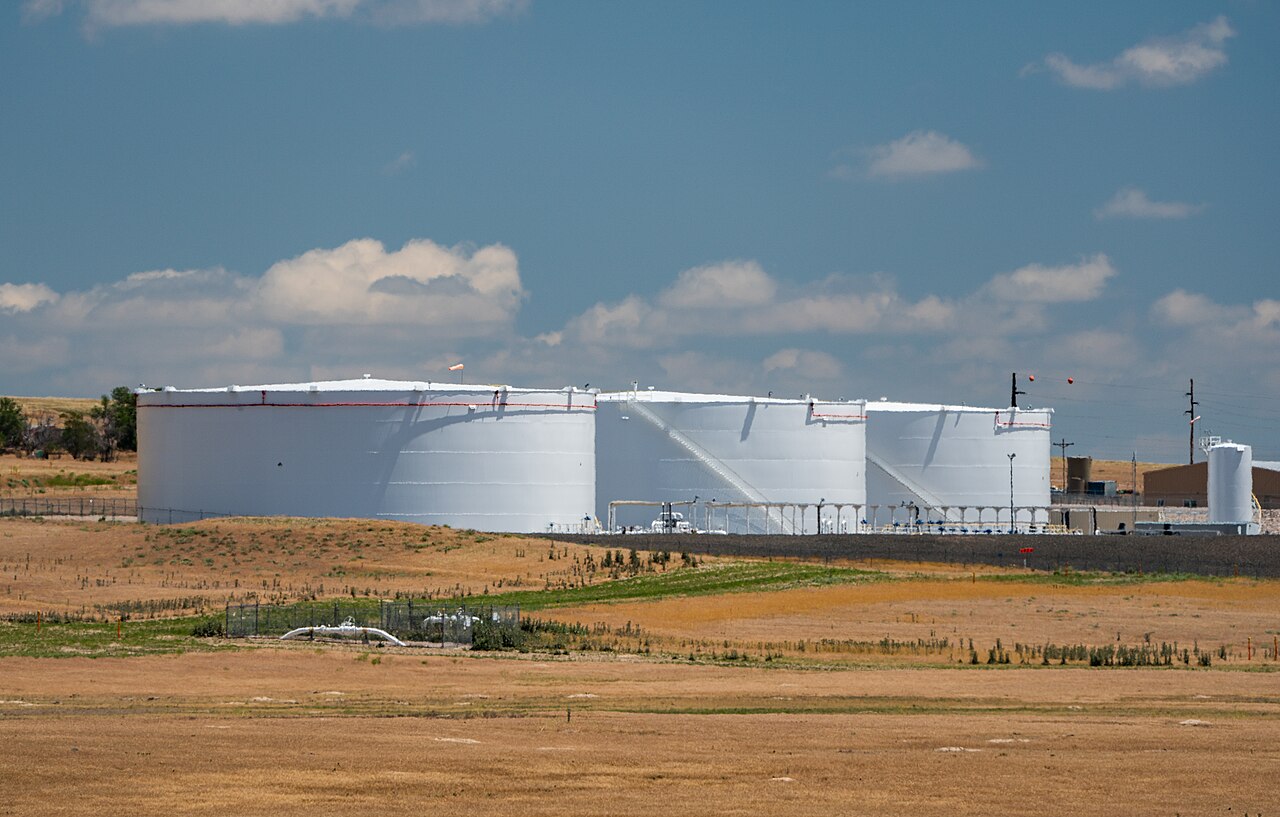
West Texas Intermediate is the quality outlier of the big three: roughly 39.6 degrees API and about 0.24% sulfur, which makes it lighter and sweeter than either Brent or Dubai. The NYMEX futures contract (symbol CL, 1,000 barrels, listed on CME Group) is the most heavily traded oil instrument in the world, and it settles by physical delivery at Cushing, Oklahoma – a tank farm of roughly 90 million barrels of capacity at the crossroads of the US pipeline grid.
That delivery mechanism is WTI’s defining feature and its known weakness. The price is anchored to inland US logistics: when Cushing tanks swell, prompt WTI cheapens against the rest of the world; when they drain toward operational minimums, it richens. The EIA publishes Cushing stocks every Wednesday in its Weekly Petroleum Status Report, and that single line item can move the front spread more than a headline war scare. In April 2020 the anchor became an anvil: with storage effectively full, the expiring May contract settled at minus $37.63 per barrel. No other benchmark has ever printed negative – a reminder that a benchmark’s delivery design is not a footnote, it is the price.
Since Washington lifted the crude export ban in December 2015, WTI has gone global – US barrels load at Corpus Christi and Houston and price into European and Asian refineries daily. The full story of how the American and global benchmarks interact, including the famous spread between them, is in our breakdown of WTI vs Brent.
Brent: The World’s Default Price
Brent is the benchmark most of the planet actually uses. Between two-thirds and 80% of internationally traded crude prices off Brent directly or through Brent-linked formulas, and the ICE Brent futures contract (exchange symbol B – not “BRN,” which is a broker-specific display code) is the instrument behind it: 1,000 barrels, cash-settled against the ICE Brent Index. That last detail matters. Unlike WTI, ICE Brent futures never turn into physical oil; at expiry they settle in cash against an index computed from actual North Sea cargo trading. The futures market is a financial shadow of a physical cargo market that trades alongside it – Dated Brent, the price of specific cargoes with loading dates, is the number most physical contracts reference.
The barrel itself is light, sweet crude of around 38 degrees API and 0.4% sulfur. But “Brent” long ago stopped meaning oil from the Brent field, which has been decommissioned. The deliverable basket has been widened repeatedly to keep the benchmark liquid as North Sea output declined: Forties and Oseberg joined the assessment in 2002, Ekofisk in 2007, Troll in 2018, and – the big one – WTI Midland in June 2023, making an American grade part of the world’s global benchmark. Brent survives not because of geology but because the market keeps renovating it. That adaptability is exactly why it remains the default price for Atlantic basin grades from Nigeria, West Africa broadly, the Mediterranean, and the Caspian.
Dubai and Oman: The Eastern Benchmarks
Asia buys more crude than any other region, and most of what it buys is medium-gravity, higher-sulfur Middle Eastern oil that looks nothing like WTI or Brent. Pricing that flow off a light sweet North Sea basket would misrepresent the barrels, so the market built an eastern reference: the Dubai/Oman complex.
Dubai crude runs around 31 degrees API with roughly 2% sulfur – a medium sour grade, which is precisely the point: it resembles the Saudi, Iraqi, Kuwaiti and Iranian barrels that actually sail east. One correction to a common misconception: Dubai is not an exchange-traded futures contract. It is a price assessment published by Platts, built from a trading window in Singapore hours where partial cargoes (“partials”) change hands among the big physical players. Oman is the complex’s exchange-traded leg: Oman crude futures (around 30-34 degrees API, roughly 1% sulfur or a bit more) trade on the Dubai Mercantile Exchange – renamed the Gulf Mercantile Exchange in 2024 – and, unusually for the region, settle into physical delivery. Saudi Aramco and other Gulf producers reference the average of Platts Dubai and the Oman futures settlement in their Asian pricing formulas, which makes this complex the reference for the single largest crude trade flow on earth.
The Big Three at a Glance
| WTI | Brent | Dubai / Oman | |
|---|---|---|---|
| Quality | ~39.6° API, ~0.24% S (light, sweet) | ~38° API, ~0.4% S (light, sweet) | ~31° API, 1-2% S (medium, sour) |
| Pricing instrument | NYMEX CL futures (physical delivery, Cushing) | ICE B futures (cash-settled) + Dated Brent assessment | Platts Dubai assessment + Oman futures (physical) |
| Region priced | North America | Atlantic basin / global default | Middle East exports to Asia |
| Price driver | US production, Cushing stocks | Seaborne Atlantic supply-demand | Gulf OSPs, Asian refinery demand |
| Share of trade priced | US domestic + export formulas | Roughly two-thirds to 80% of world trade | Roughly a fifth to a quarter of world trade |
API Gravity: The Quality Scale That Sets the Hierarchy
API gravity is the industry’s density scale – higher numbers mean lighter oil. The conventional cut lines: light crude sits above roughly 31 degrees, medium runs from about 22 to 31, and heavy falls below 22. WTI (39.6) and Brent (38) are comfortably light; Dubai (31) sits right at the light-medium boundary and Oman just above it, which is why traders describe the pair as “medium” in practice; Canadian heavy grades like WCS, near 20 degrees, are firmly heavy. A handful of grades – Tapis from Malaysia at around 44-45 degrees – are lighter than anything in the benchmark trio.
Lighter is generally worth more because simple distillation of a light barrel yields more gasoline, diesel and jet fuel, while a heavy barrel yields residual fuel that must be upgraded in expensive secondary units. But the premium is not a constant. When diesel cracks scream higher, medium barrels rich in distillate gain on light ones; when gasoline leads, the light sweet grades stretch their lead. Quality spreads are a market, not a table of fixed discounts.
Sulfur: Sweet vs Sour
Sulfur is the other axis of crude quality. The industry’s rough convention calls crude below 0.5% sulfur “sweet” and above it “sour” (NYMEX’s deliverable spec for WTI is stricter still, at 0.42% maximum). Sulfur must be removed to meet fuel regulations, and removal takes hydrotreating capacity, hydrogen, and money – so sour crude trades at a discount that widens when refining capacity is tight and narrows when complex refiners are hungry for feedstock.
WTI (0.24%) and Brent (0.4%) are sweet. Dubai and Oman are sour. Genuinely tough grades – Arab Heavy at nearly 3% sulfur, Venezuelan Merey above 3% – trade many dollars under the benchmarks and can only go to refineries built to digest them. This is why “the oil market” is really several partially connected markets: a simple refinery physically cannot switch from Bonny Light to Merey because the price is attractive.

The Rest of the Board: Regional Benchmarks Worth Knowing
Urals (Russia): the medium-sour workhorse of Russian exports, around 31-32 degrees API and 1.3-1.7% sulfur. Once the staple diet of European refining, priced as a differential to Brent; since 2022, sanctions and the G7 price cap pushed Urals east to India and China at discounts that became one of the most-watched numbers in the market.
ESPO (Russia): the Pacific export blend shipped from Kozmino, lighter and sweeter than Urals (roughly 34-35 degrees, ~0.5% sulfur), priced against Dubai and increasingly the marginal barrel in Chinese teapot refineries.
Bonny Light and the Nigerian grades: light, very sweet (about 35 degrees, ~0.15% sulfur), gasoline-rich crudes priced off Dated Brent. Their differentials are a live gauge of Atlantic basin gasoline demand.
Tapis (Malaysia): ultra-light, ultra-sweet, historically the Asia-Pacific light sweet marker and still quoted, though thin production has reduced it to a niche reference.
Western Canadian Select (WCS): the heavy sour Canadian benchmark, blended oil sands crude around 20-21 degrees API and ~3.5% sulfur, priced at Hardisty, Alberta as a discount to WTI. The WCS-WTI spread blows out whenever Canadian production outruns pipeline capacity – a Cushing story with colder weather.
Murban (UAE): the newest serious contender. Light (around 40 degrees) and modestly sour, Murban got its own physically delivered futures contract on ICE Futures Abu Dhabi in March 2021, and ADNOC now prices its exports off it. Watch this one: it is the Gulf’s first real attempt at exchange-based, destination-free pricing of its own crude.
How Benchmark Prices Are Actually Set
Here is the part almost nobody outside the industry understands: most “benchmark prices” are not exchange settlements. They are assessments published by price reporting agencies, and the mechanics matter.
Platts and the Market-on-Close window
S&P Global Platts assesses Dated Brent, Dubai, and dozens of other grades through its Market on Close (MOC) process: a defined window at the end of the trading day (16:30 in London for Brent, Singapore afternoon for Dubai) in which participating firms post bids, offers and trades that Platts editors observe and translate into the day’s published price. The design principle is that transparent, executable activity at the close beats a survey of opinions. The criticism – traders voice it freely – is that a window narrow enough to observe is also narrow enough to push. Either way, enormous volumes of physical crude, term contracts, and derivatives settle against these assessments, which is why participation in the window is a professional discipline of its own.
Argus and the alternatives
Argus Media publishes competing assessments with different methodologies – volume-weighted averages over full trading days rather than a closing window, in several key markets. The most consequential Argus number is ASCI, the Argus Sour Crude Index, which Saudi Arabia, Kuwait and Iraq use to price their exports to the United States. When producers choose which agency’s number goes in their contracts, that choice itself moves markets – benchmarks compete for business just like exchanges do.
Futures settlements
NYMEX WTI settles on exchange trading, with physical convergence enforced by delivery at Cushing. ICE Brent settles to the cash Brent Index at expiry. Futures give the market its continuous, transparent price signal; the assessments tie that signal to actual wet barrels. The system only works because both layers exist – and most of the time it works remarkably well.
Saudi OSPs: The Monthly Price Everyone Waits For
Saudi Aramco, the largest crude exporter, does not sell spot cargoes at whatever the screen says. Around the start of each month it publishes Official Selling Prices – differentials to a benchmark, set separately for each grade and each destination region. Asian customers pay the average of Platts Dubai and Oman futures plus or minus the OSP adjustment; European buyers get formulas tied to ICE Brent; US buyers get ASCI-linked pricing. Note what that means: the common claim that “all Saudi crude is priced off Brent” is wrong – the kingdom’s largest market, Asia, prices off Dubai/Oman.
The monthly OSP announcement is a market event in its own right. When Aramco cuts its Arab Light OSP to Asia more than the market expected, traders read weak Asian demand or a market-share fight; an aggressive hike signals tightness. During the March 2020 price war, Aramco slashed OSPs by $6 to $8 in a single announcement – the opening shot of a crash that ended with WTI below zero six weeks later. Because Iraq, Kuwait, Iran and others set their own formulas partly in reaction to Aramco’s, the OSP system quietly coordinates the pricing of the entire Gulf export complex. It is also, of course, one of the levers behind cartel strategy – covered in depth in our guide to how OPEC controls oil prices.
How the World Ended Up Pricing Oil This Way
The benchmark system is younger than most people assume. Into the early 1980s there was no meaningful market price for oil at all: the majors and then OPEC simply administered prices, posting official numbers and adjusting them by committee. That system died in the mid-1980s when Saudi Arabia, tired of defending prices by cutting its own output while others cheated, flooded the market and tied its sales to spot-market values. Administered pricing never came back. What replaced it was the architecture we have now: futures exchanges for transparent price discovery – NYMEX listed WTI futures in 1983, London’s IPE listed Brent in 1988 – and price reporting agencies to assess the physical grades that futures could not cover.
It is worth sitting with that history for a moment, because it explains the system’s quirks. Nobody designed a three-benchmark world; it accreted. WTI became a benchmark because Cushing had pipes and tanks. Brent became one because North Sea cargoes had clean legal title and a forward market. Dubai became one because it was the rare Gulf crude free of destination restrictions in the 1980s. Each was the least-bad candidate in its region at the moment the old pricing order collapsed – and forty years of accumulated contracts, hedges and habits have kept them in place ever since.
The Brent-Dubai Spread: The East-West Valve
Beyond Brent-WTI, one inter-benchmark spread matters enough to deserve its own paragraph: Brent versus Dubai, traded professionally through an instrument called the EFS (exchange of futures for swaps). Because Brent is light sweet and Dubai is medium sour, the spread tracks both the quality premium and the east-west balance of the market. When Brent-Dubai narrows, Atlantic basin light sweet crude becomes competitive in Asia and West African cargoes start sailing east; when it widens, Asia leans back on Gulf supply. Physical traders watch it like a valve on the world’s biggest pipe. A persistent, unusual narrowing – Dubai trading at parity with or even over Brent, as has happened during OPEC+ cuts that removed mostly sour barrels – tells you the medium sour market is tight regardless of what headline prices are doing.
Cushing: The Tank Farm That Prices a Continent
Cushing, Oklahoma deserves its own section because no other benchmark has a single point of failure quite like it. Roughly 90 million barrels of shell capacity, pipeline connections in every direction – crude arrives from the Permian via Basin, from Canada via Keystone, and departs for the Gulf Coast on Seaway and MarketLink. (Contrary to an error that circulates endlessly online, the Colonial Pipeline is not part of this system; Colonial carries refined products from the Gulf Coast to the East Coast.)
Traders watch Cushing the way cardiologists watch an EKG. Stocks near operational lows (tanks need minimum volumes to function) make the WTI curve snap into backwardation, with prompt barrels commanding a premium. Stocks near the brim produce contango – prompt discounts that pay the storage trade – and, at the 2020 extreme, a negative print. If you want to understand why inventories transmit into price shape this way, our piece on oil supply and demand fundamentals walks through the mechanism.

A worked example: pricing one real cargo
To make the machinery concrete, walk through a single deal. A Nigerian producer sells a million-barrel cargo of Bonny Light to a European refiner. The contract will not name a fixed price; it will say something like “Dated Brent, averaged over five days around bill of lading, plus the agreed differential.” Suppose they agree at Dated Brent plus $1.20. The cargo loads in late August; the pricing window catches Dated Brent averaging $81.40; the invoice prices at $82.60 per barrel – about $82.6 million. Every input except the $1.20 differential came from the benchmark system: the Platts assessment, itself anchored by the futures curve, itself arbitraged against physical cargoes. The producer, meanwhile, may have hedged the flat-price risk months earlier by selling ICE Brent futures, leaving only the differential exposed. Multiply that structure by thousands of cargoes a month and you have the actual global oil market – a thin, negotiated layer of differentials riding on a deep, shared layer of benchmark prices.
Quality Differentials and Crack Spreads
Every physical grade trades as a differential to its benchmark, and those differentials are where the real information lives. A rough illustration of the structure: with Brent as the marker, Bonny Light might trade a dollar or two over, Urals several dollars under (far more since 2022), Dubai-linked medium sours a couple of dollars under, and heavy sours like Arab Heavy or WCS many dollars below. The differentials expand and contract with refinery appetite, freight, and product cracks – a widening light-heavy spread, for instance, tells you complex refiners are minting money running cheap heavy crude.
Crack spreads connect crude to products: the classic 3-2-1 crack approximates a refinery buying three barrels of crude and selling two of gasoline and one of diesel. When cracks are fat, refiners run hard and bid up crude; when cracks collapse, run cuts follow and crude demand sags. Benchmark traders who ignore the product side are trading with one eye shut – it is often the cracks that move first.
Benchmarks in Flux
The benchmark map is not static, and the direction of travel is clear. Brent has been renovated four times in two decades and now contains American crude. Murban gave the Gulf its first credible exchange benchmark. Russian grades tore themselves out of the European pricing fabric after 2022 and rewove into Asian trade at politically determined discounts. And WTI, left for dead as a “landlocked” benchmark in 2011, came back global once exports opened. The lesson for traders: benchmark relationships that look permanent are really infrastructure and politics wearing a steady disguise. When either changes, the spreads reprice first and the commentary catches up later.
It is the same pattern in other energy markets – US natural gas went through its own benchmark consolidation around Henry Hub pricing, for exactly the same liquidity-concentration reasons.
One more practical habit separates professionals from tourists here: when a headline says “oil rose 2%,” ask which oil. On a day when Cushing draws hard, WTI can rally while Dubai barely moves; during a freight squeeze, Brent can jump while WCS collapses. The benchmarks are cousins, not clones, and the divergences between them are frequently the most tradeable information on the screen.
What This Means When You Trade
Practical takeaways. First, know which benchmark your instrument actually references – an oil ETF, a CFD, and a futures contract may track different curves, and the differences compound. Second, watch the spreads between benchmarks (Brent-WTI, Brent-Dubai, WCS-WTI) as information even if you never trade them; they tell you where barrels are stranded and where they are scarce. Third, respect the assessment machinery: prices set in a Platts window or a monthly OSP release move on their own calendar, not yours.
Benchmarks are the grammar of the oil market – learn them once and everything else you read suddenly parses. For the full course, from contract mechanics to risk management, continue with our crude oil trading guide, or go deeper on the two-benchmark rivalry in WTI vs Brent.