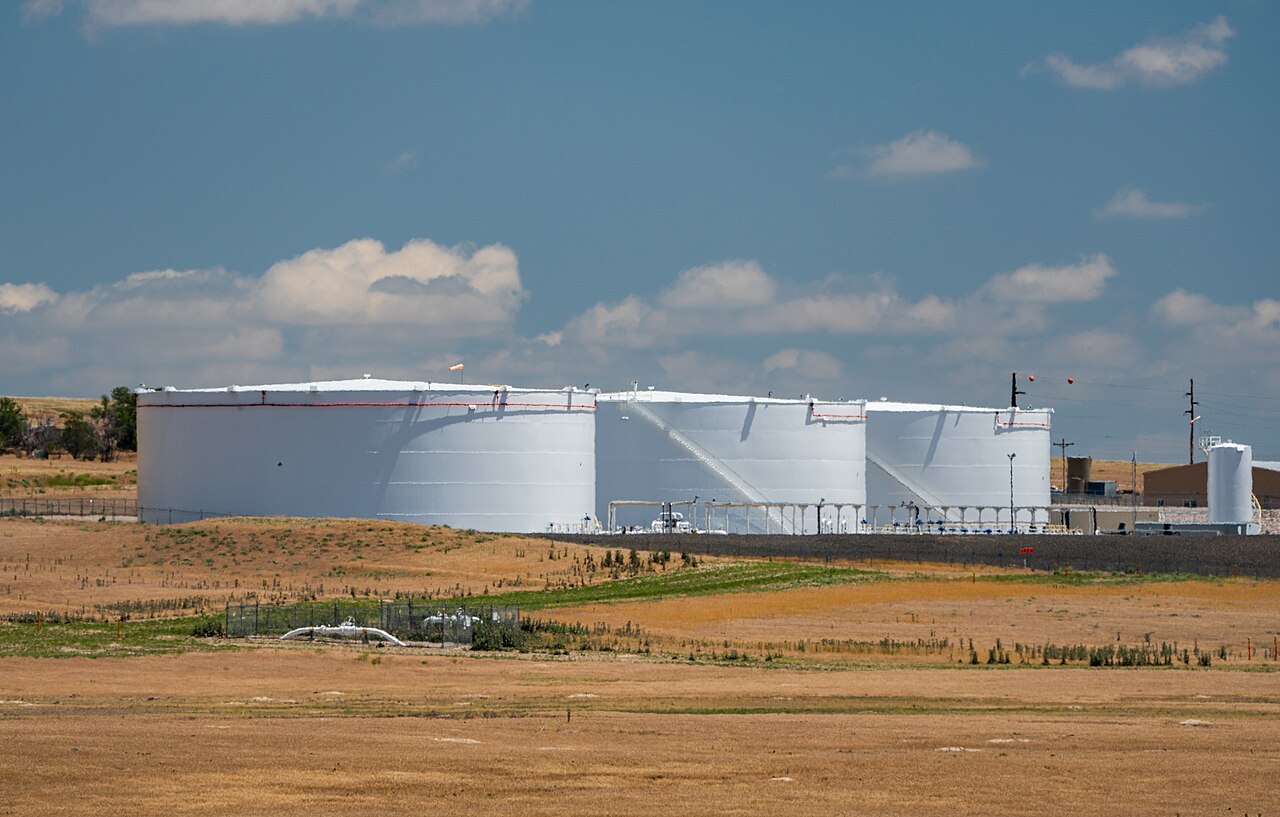
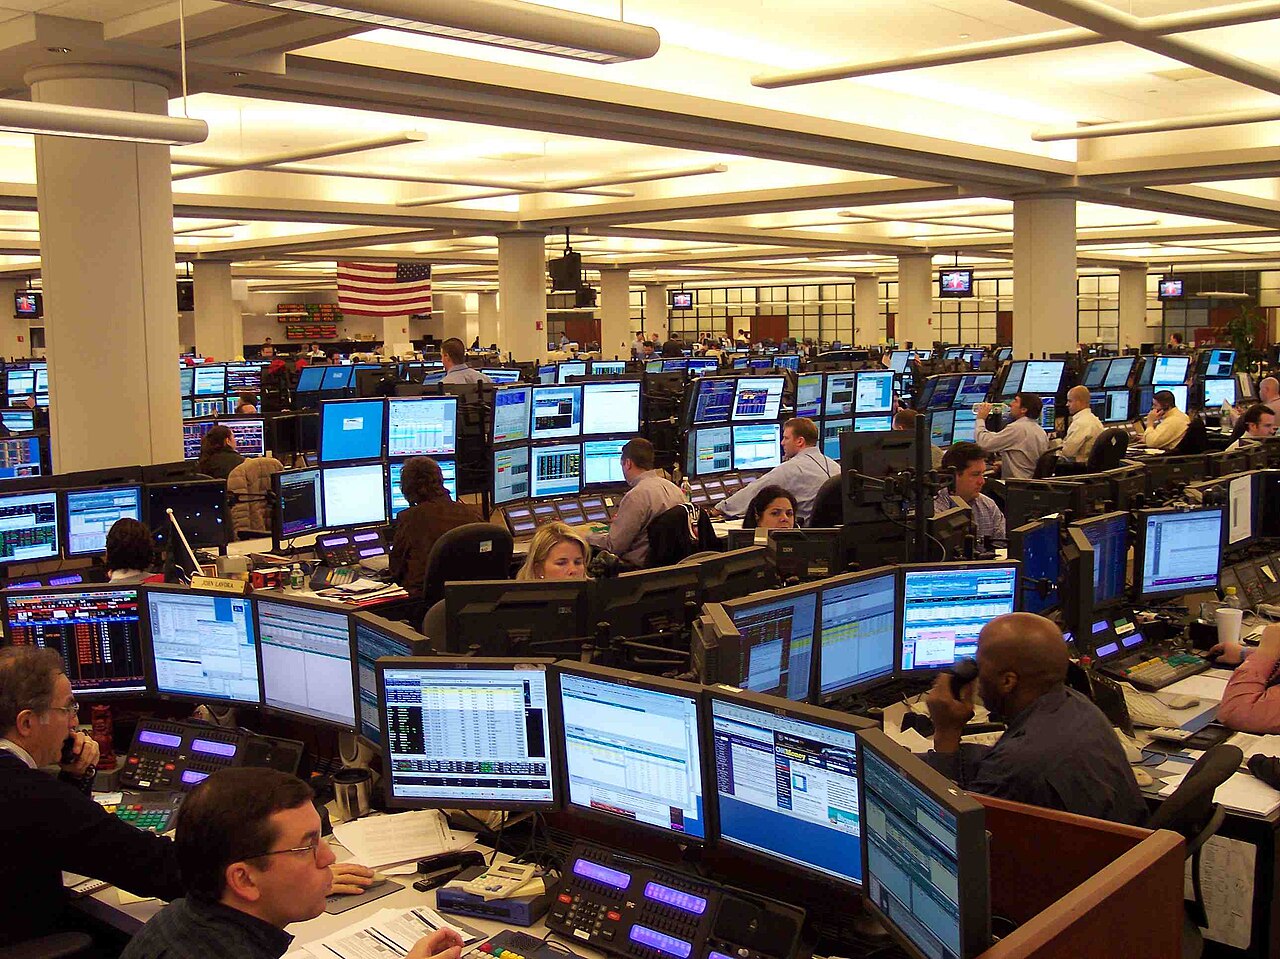
Crude oil is the most actively traded commodity on earth – notional volumes across WTI and Brent futures alone run into the hundreds of billions of dollars a day, dwarfing the physical market they price. That liquidity, plus volatility that regularly embarrasses equity indices, is why crude oil trading attracts everyone from airline hedging desks to one-lot retail traders. It is also why the market punishes the unprepared so efficiently.
This is the pillar guide for everything we publish on crude: what the oil market actually is, the benchmarks and instruments, how professionals analyze it, how they manage risk in it, and the history you need to know so the next blowup doesn’t surprise you. Where a topic deserves its own deep dive – futures mechanics, WTI vs Brent, supply and demand – we link out to it. Treat this page as the map.
Why Crude Oil Is the Market Everyone Watches
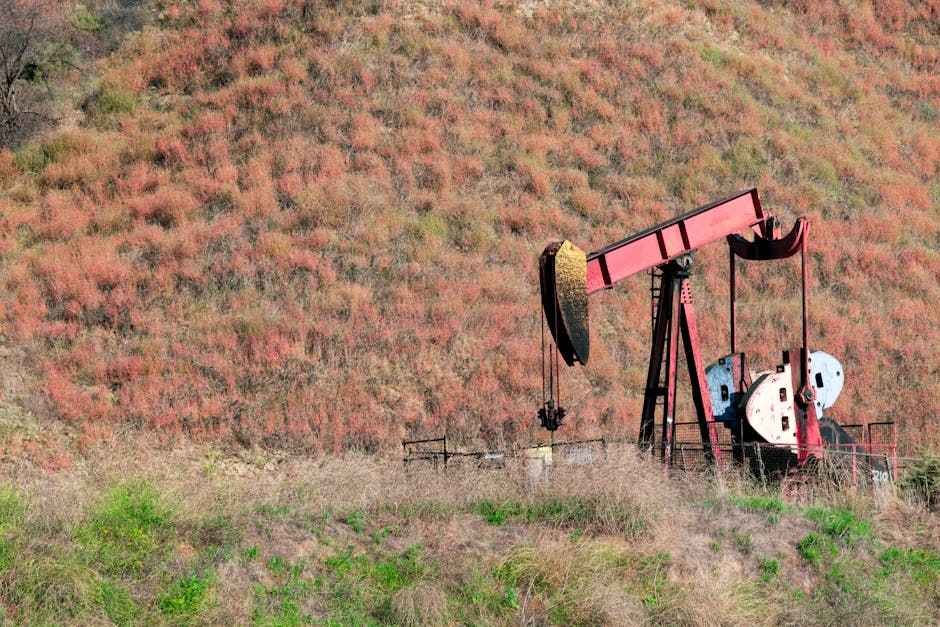
The world burns through roughly 100 million barrels of oil every day. Every one of those barrels moves from a wellhead through pipelines, tankers, storage tanks and refineries before becoming gasoline, diesel, jet fuel, or petrochemical feedstock – and every stage of that chain generates price risk that someone needs to hedge. Producers hedge selling prices, refiners hedge margins, airlines hedge fuel costs, and speculators take the other side of all of it. The result is a market that trades nearly 24 hours a day, five-plus days a week, with depth that lets you move serious size without moving the price.
For a trader, three properties make crude special. First, liquidity: the front-month WTI contract alone routinely trades over a million contracts a day. Second, volatility: 2-3% daily moves are unremarkable, and regime changes – OPEC surprises, wars, pandemics – produce 10%+ days that equity traders see once a decade. Third, analytical richness: oil responds to physical data (inventories, production, refinery runs), macro data (GDP, dollar, rates), and geopolitics, which means there is always a thesis to test and always someone on the other side who has done less homework than you. That last point cuts both ways.
A Short History of Oil Prices: The Regimes That Made This Market
You cannot read an oil chart intelligently without knowing what the big moves were. A compressed history, desk version:
1986 – the countershock. Saudi Arabia, exhausted from defending prices by cutting its own production while other OPEC members cheated, opened the taps. Prices collapsed from around $30 to near $10. The era of administered oil pricing died here; market pricing – futures, spot cargoes, price assessments – took over for good.
1990 – Kuwait. Iraq’s invasion doubled prices in about three months, then the market gave nearly all of it back once it was clear supply would cope. The template for every supply scare since: the spike is fast, the retracement faster, and the traders who buy the headline late fund the ones who sold it early.
2008 – $147 and the crash. WTI ran from about $95 to an intraday record near $147 in July 2008 on emerging-market demand and a weak dollar, then collapsed below $40 within six months as the financial crisis hit. Lesson: oil is a macro asset, and when credit dies, demand forecasts die with it.
2014-2016 – the shale glut. US shale output had grown so fast that OPEC, in November 2014, declined to cut and chose to defend market share instead. Prices went from over $100 to under $30 by early 2016. The bet was that shale would die at low prices; instead it got more efficient. This episode still defines the strategic chess game between OPEC+ and US producers – covered properly in our guide to how OPEC controls oil prices.
April 2020 – below zero. COVID lockdowns vaporized demand, a Saudi-Russian price war flooded supply, storage filled, and on April 20, 2020 the expiring May WTI contract settled at minus $37.63 per barrel. More on this below, because it is the single most instructive day in modern oil trading.
2022 – the invasion. Russia’s invasion of Ukraine sent Brent above $120 and triggered the largest-ever release from the US Strategic Petroleum Reserve – 180 million barrels. Sanctions rewired global crude flows: Russian barrels went east at discounts, Atlantic barrels replaced them in Europe, and freight became a trading input as important as inventories.
Notice the pattern: every regime change came from the supply side or from macro shocks, arrived faster than consensus expected, and repriced not just the level of oil but the relationships between grades, months, and regions. That is why professionals trade spreads and curves, not just direction.
The Benchmarks: WTI, Brent, and Dubai/Oman
All crude oil trading references a benchmark, so start here. The full taxonomy – including Urals, Murban, WCS and how price assessments actually work – lives in our guide to crude oil benchmarks; this is the working summary.
WTI (West Texas Intermediate) is the North American benchmark: light (about 39.6 degrees API), sweet (about 0.24% sulfur), delivered physically at Cushing, Oklahoma. The NYMEX futures contract, symbol CL, is the most liquid oil instrument in the world. Because settlement means real barrels into real tanks, WTI’s price is chained to US logistics – Cushing inventory data moves it in a way no other single number does.
Brent is the global benchmark, pricing somewhere between two-thirds and 80% of internationally traded crude. Slightly heavier and more sulfurous than WTI (roughly 38 degrees, 0.4% sulfur), it trades on ICE under the symbol B and settles in cash against an index of physical North Sea cargo trading – no physical delivery through the futures. The deliverable basket has expanded over the years to include Forties, Oseberg, Ekofisk, Troll and, since June 2023, WTI Midland. The two benchmarks’ differences – and the famous spread between them – get the full treatment in WTI vs Brent: the differences that matter.
Dubai/Oman is the eastern reference: medium-gravity, sour crude that resembles what Gulf producers actually ship to Asia. Dubai is a Platts price assessment rather than a futures contract; Oman futures trade on the Gulf Mercantile Exchange (formerly DME). Saudi Aramco prices its Asian sales off the Dubai/Oman average, which makes this complex the benchmark for the largest physical crude flow in the world.
How to Trade Crude Oil: The Instruments
Futures: the professional default
Futures are the core of the market – everything else derives from them. A standard NYMEX WTI contract controls 1,000 barrels, so at $75 oil you are steering $75,000 of notional exposure with an initial margin deposit that is typically in the $6,000-$8,000 range depending on volatility. Every $1 move in crude is $1,000 per contract, in either direction. A routine $3 day is $3,000 – which is the whole story of futures in one number: unmatched capital efficiency, unforgiving leverage.
CME’s smaller contracts changed who can trade this market sensibly. The E-mini (QM) covers 500 barrels; the Micro WTI (MCL), launched in 2021, covers 100, with margins in the hundreds rather than thousands of dollars. A new trader who insists on starting with full-size CL contracts is choosing ego over survival. Contract specs, margin mechanics, expiry rules, and rollover technique are covered step by step in our guide to how to trade crude oil futures, with the current specifications on CME Group’s site.
Options: defined risk, priced accordingly
Options on crude futures let you express a view with a known maximum loss. Ahead of an OPEC+ meeting you expect to be bullish, you might buy a call for a $1,500 premium instead of posting $7,000 margin on a future – your worst case is the premium, full stop. The catch is that oil options are rarely cheap: the market knows perfectly well that crude gaps, and implied volatility around scheduled events gets bid up hard. Buying options is paying for insurance everyone wants; selling them is collecting premium in front of a market famous for 10% days. Spreads – verticals, calendars, strangles sized responsibly – are how most professionals square that circle. Options also shine as hedges: a producer long physical barrels can buy puts and keep upside, which is something a futures hedge cannot do.
ETFs: convenient, and quietly expensive
Oil ETFs like USO hold futures, not barrels, and they must roll expiring contracts into later months every cycle. When the curve is in contango – later months pricier than near ones, the normal state in well-supplied markets – each roll sells cheap and buys dear. That drag is why long-term USO holders have historically underperformed spot oil by embarrassing margins, and why the fund’s own restructuring in April 2020 (forced diversification across months as the front contract imploded) should be required reading. Use oil ETFs for short-term tactical exposure in an equity account; do not “buy and hold oil” through a rolling futures fund and expect the chart on television.
CFDs: access with asterisks
Contracts for difference replicate oil exposure through a bilateral contract with your broker. They are widely used in Europe, Asia and Australia (US retail traders cannot trade them), offer flexible sizing and easy shorting, and carry two structural costs worth respecting: you are exposed to your broker as a counterparty rather than to a cleared exchange, and financing plus spread costs quietly compound for positions held beyond a few days. Fine for nimble trading with a reputable, regulated broker; wrong instrument for anything resembling an investment.
Choosing your market: a quick decision table
| Instrument | Size / leverage | Best for | Main hazard |
|---|---|---|---|
| WTI futures (CL) | 1,000 bbl, high leverage | Experienced directional and spread traders | Leverage; delivery at expiry |
| Micro WTI (MCL) | 100 bbl, modest margin | Beginners, precise sizing | Wider relative costs on very short timeframes |
| Brent futures (B) | 1,000 bbl, cash-settled | Global-macro views, non-US hours | Less liquid than CL in US session |
| Options on futures | Defined risk per structure | Event trades, hedging, volatility views | Premium decay; paying rich implied vol |
| Oil ETFs (USO etc.) | Unleveraged equity ticket | Short-term tactical exposure in equity accounts | Contango roll drag over time |
| CFDs (non-US) | Flexible, broker-set leverage | Small accounts outside the US | Counterparty and financing costs |
Contango, Backwardation, and Why the Curve Is the Market
Flat price gets the headlines; the shape of the futures curve carries the information. When near-month contracts trade below deferred months, the curve is in contango – the signature of a well-supplied or oversupplied market, because it pays the storage trade: buy prompt oil, tank it, sell a deferred future, collect the spread. High inventories at Cushing and contango go hand in hand. When prompt contracts command a premium over deferred – backwardation – the market is bidding urgently for barrels now, the classic signature of tightness. (You will see these terms swapped carelessly in commentary; they are not interchangeable, and getting them backwards inverts every conclusion that follows.)
Traders use the curve three ways. As a diagnostic: the front spread is often a cleaner read on physical tightness than flat price. As a position: calendar spreads – long one month, short another – let you trade the balance without taking flat-price risk. And as a cost: anyone holding rolling long positions (ETFs included) pays contango or collects backwardation every month, which over a year can matter more than the direction call. The extreme case came in April 2020, when the May-June WTI spread blew out past $50 in super-contango. The curve was screaming “no storage” for weeks before the negative print made it famous.
Who You Are Trading Against
Before choosing a strategy, know the cast. Commercial hedgers – producers, refiners, airlines, physical trading houses – are the market’s anchor tenants. They trade to offset real-world exposure, which means they will happily sell into rallies and buy into breaks for reasons that have nothing to do with price forecasts. Managed money – hedge funds and CTAs – supplies the trend: momentum systems pile into moves and amplify them, then exit en masse when signals flip, which is why crude trends overshoot in both directions. Options dealers hedge their books mechanically, and their flows can pin prices near big strikes into expiry or accelerate moves through them. Retail provides the liquidity everyone else eats around scheduled events.
The CFTC’s weekly Commitments of Traders report shows you the positioning skeleton: when managed-money length reaches historic extremes, the marginal buyer is already in, and the market becomes vulnerable to violent unwinds that need no fundamental trigger at all. Positioning washouts masquerade as news events constantly in crude. Check positioning before assuming a $4 down day means the world changed – sometimes it just means everyone was long.
Spreads and Relative Value: How Professionals Actually Trade Oil
Retail trades direction; desks mostly trade relationships. Three families are worth knowing even if you start with outright positions. Calendar spreads (long one contract month, short another) isolate the supply-demand balance from macro noise – the front spread is the purest inventory trade in the market. Quality and location spreads, headlined by Brent-WTI, trade the logistics of moving barrels between regions. Crack spreads trade refining margins – the classic 3-2-1 crack approximates buying three barrels of crude against selling two of gasoline and one of diesel, and it is how the market prices the refining industry’s profitability in real time.
Why prefer spreads? Lower margin, cleaner theses, and insulation from the macro tide: a calendar spread does not care whether the Fed surprised, only whether barrels are tight. The trade-off is that spreads demand more market knowledge, not less – they move on pipeline schedules, storage economics and refinery turnarounds, and the worst losses in spread trading come from discovering a logistics fact after the market did. Start with outrights in micro size; graduate to spreads when the curve section of this guide reads like common sense.
Fundamental Analysis: Reading the Physical Market
Oil prices ultimately settle where global production meets global consumption, and fundamental analysis is the discipline of tracking that balance faster and more honestly than consensus. The full framework – inventories as the market’s scoreboard, elasticities, the data calendar – is in our deep dive on oil supply and demand fundamentals. The essentials:
Supply: three blocs that matter
OPEC+. The cartel and its allies control roughly 40% of world production and, more importantly, nearly all of the world’s spare capacity – the only oil that can be switched on in weeks rather than years. Their meetings, quota decisions, and compliance games are the single most powerful scheduled price driver in the market. Read the announcements yourself at opec.org, then read what the market believed before deciding what the announcement means; the surprise, not the number, moves price.
US shale. American output above 13 million barrels per day made the US the world’s largest producer, and shale’s short investment cycle makes it the market’s fastest supply response. Weekly Baker Hughes rig counts and EIA production estimates are the leading indicators; the lag from price signal to production response runs roughly six to twelve months.
Everyone else. Long-cycle conventional projects – Brazil, Guyana, Canada, Norway – arrive on schedules set years earlier, indifferent to today’s price. Guyana went from zero to over half a million barrels a day in half a decade; ignoring non-OPEC growth was the consensus mistake of the early 2020s.
Demand: slower, but it wins arguments eventually
Oil demand tracks the global economy – China and India at the growth margin, the OECD as the stable base – and bends with seasons: summer driving, winter heating, spring and fall refinery maintenance windows when crude buying dips. Demand moves slowly compared with supply shocks, but when it turns (2008, 2020), nothing else matters. Petrochemicals and aviation are where the marginal growth lives; watch those, not just gasoline.
The macro layer: dollar, rates, and positioning
Crude is priced in dollars, so a strong dollar mechanically pressures oil and a weak one flatters it – the correlation is loose day to day but persistent across quarters. Interest rates work through two channels: they set the cost of financing inventory (higher rates make storage trades more expensive, all else equal) and they shape the growth expectations that drive demand forecasts. And in inflationary episodes, oil attracts financial flows that have nothing to do with barrels – portfolio managers buying commodity exposure as a hedge. None of this replaces physical analysis, but ignoring the macro layer leaves you baffled on the days oil moves 2% with no oil news whatsoever.
The data calendar that structures the week
Tuesday 4:30 p.m. ET: the American Petroleum Institute’s inventory survey, the unofficial preview. Wednesday 10:30 a.m. ET: the EIA’s Weekly Petroleum Status Report – crude and product inventories, production, imports, exports, refinery runs, and the Cushing number that WTI spread traders live on. Friday 1:00 p.m. ET: Baker Hughes rig count. Monthly: OPEC’s Monthly Oil Market Report and the IEA’s Oil Market Report, whose demand-forecast revisions can set the tone for weeks. The market does not react to whether the numbers are good or bad; it reacts to whether they differ from what was already priced. Internalize that distinction and half the confusing price action you see on data days starts making sense.

Technical Analysis: Timing in a Fundamental Market
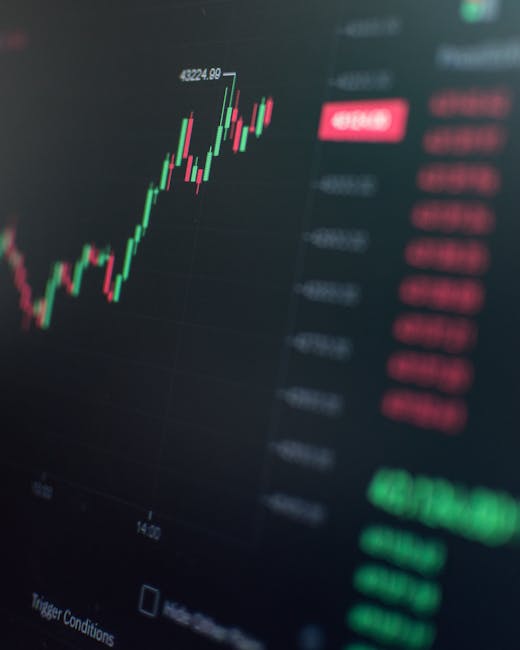
Fundamentals tell you where price should go; technicals tell you when the market agrees. Crude is a heavily technical market for one practical reason: an enormous share of daily volume is systematic – trend followers, volatility targeters, options dealers hedging – and those flows respond to levels and momentum, not to inventory reports.
Levels. Support and resistance in crude form at prior consolidation zones and, conspicuously, at round numbers – $70, $75, $80 attract orders the way porch lights attract moths. Breakouts through widely watched levels tend to travel because stops and momentum systems fire together.
Trend and momentum. The 50- and 200-day moving averages define the regime most funds trade around; golden and death crosses matter here not as magic but because billions of systematic dollars treat them as signals. Shorter-term traders lean on the 9- and 21-day EMAs for momentum shifts. RSI extremes (above 70, below 30) flag stretched moves – noting that in strong trends, oil can stay “overbought” for weeks while grinding higher.
Confirmation. Volume validates breakouts, and open interest tells you whether a move is new positioning (rising OI) or old positions liquidating (falling OI) – a distinction that matters enormously at trend turns. Chart patterns – head and shoulders, double bottoms, flags – work in crude to the extent that everyone watches them; treat them as crowd-behavior maps, not prophecy.
Risk Management in Crude Oil Trading
Every veteran has watched a good analyst blow up as a trader. The difference is never the analysis; it is risk management, and in a leveraged market like crude it is not one skill among many – it is the job.
Position sizing. Risk a fixed small fraction of the account per trade – 1-2% is the standard discipline. With a $50,000 account and 2% risk, your maximum loss per idea is $1,000: one full-size WTI contract with a $1.00 stop, or one Micro contract with a $10 stop, or a defined-risk options spread. Size to the stop distance, never to conviction. Conviction is what makes traders oversize the trades that kill them.
Stops. Place stops where the trade thesis is invalidated – beyond the support or resistance that made you take the trade, or at a multiple of the Average True Range so normal noise doesn’t tag you out – and then honor them. In crude specifically, respect the gap risk: the market trades nearly 24 hours, but news does not schedule itself around your session, and a stop cannot execute inside a gap. If a position would ruin your week gapping $5 against you overnight, it is too big.
Hedging and asymmetry. Producers sell futures to lock in prices; refiners and airlines buy to cap costs; speculators can use options to cap downside while keeping upside. And every trade should clear a risk-reward bar – a minimum of 1:2 keeps you profitable even winning less than half the time, which is a realistic hit rate in this market, whatever your backtest says.
The meta-rule. Leverage means crude does not forgive averaging into losers. Adding to a losing futures position “because it’s cheaper now” is how trading accounts become cautionary tales. The market can stay irrational longer than your margin can stay funded – in April 2020 it stayed irrational all the way past zero.
Case Study: The Day Oil Went Negative
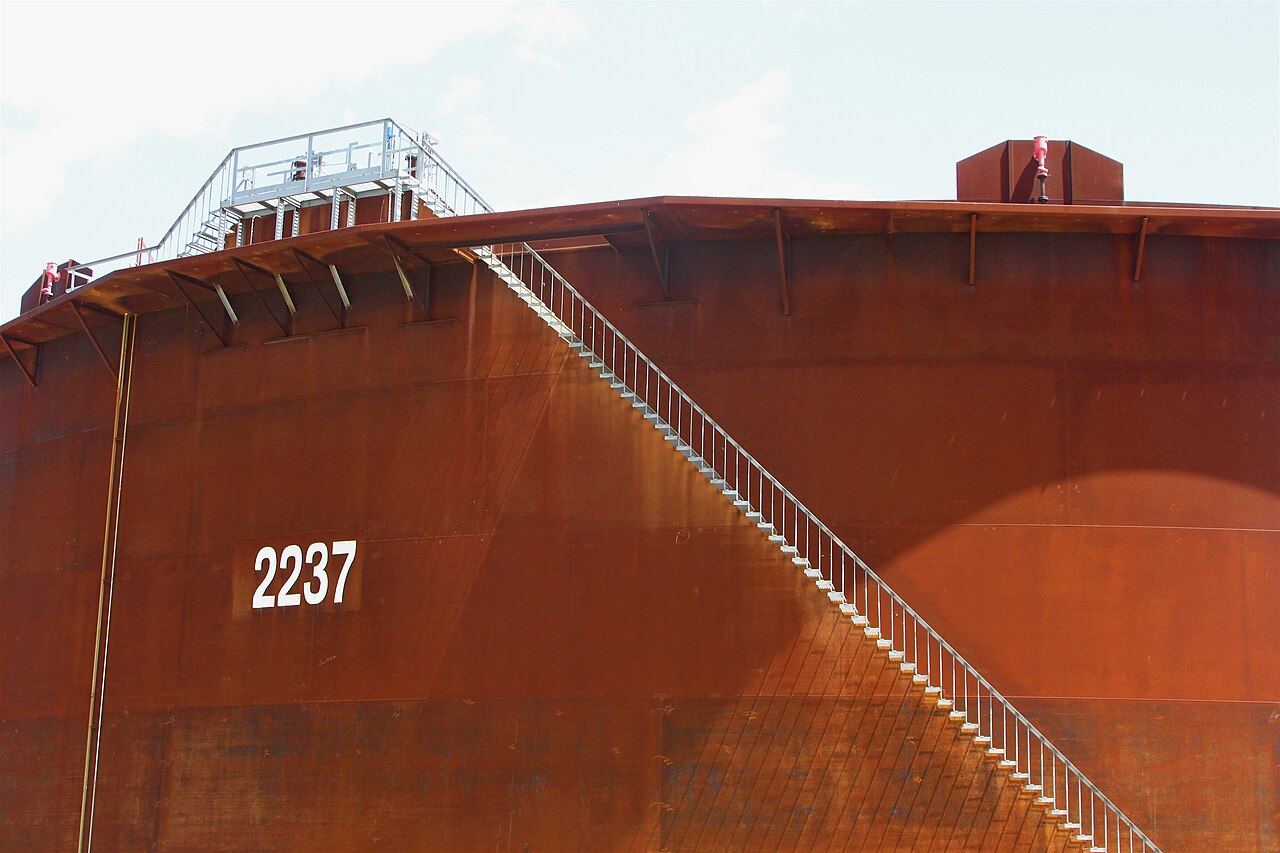
April 20, 2020 deserves its own section because it compresses every lesson in this guide into one trading day. The setup: COVID lockdowns had cut global demand by tens of millions of barrels a day. A Saudi-Russian price war had, until days earlier, been adding supply into the collapse. Storage was filling everywhere – and Cushing, the delivery point for WTI futures, was effectively fully booked.
The May WTI contract was expiring the next day. Anyone still long at expiry would have to take delivery of 1,000 barrels per contract at Cushing – where there was no tank space left to rent at any reasonable price. Longs who could not take delivery had to sell at whatever price a buyer would accept, and the only buyers were players with storage. Through the afternoon the bid vanished: $10, $5, zero – and then buyers demanded payment to take the oil. The contract settled at minus $37.63. The June contract, one month further out, closed around $20. Same oil, thirty days apart, nearly $60 of difference.
The lessons, in order of expense. Contract design matters: cash-settled Brent fell hard that month but never went negative; physically delivered WTI did. The curve knows first: super-contango had been warning about storage for weeks. Expiry is not a technicality: retail traders in oil ETFs and futures who “didn’t plan to hold to delivery” discovered the roll was where the losses lived. And the impossible has a price: every risk model that assumed oil’s floor was zero was wrong by $37.63.
A footnote to that day worth keeping: the exchange had quietly reprogrammed its systems to allow negative prices two weeks earlier, and CME’s own notices said so. The traders who read exchange circulars knew the floor had been removed; the ones who assumed zero was a law of nature found out otherwise. Boring operational reading is a trading edge more often than anyone admits.
A Worked Trade: Fading the Inventory Overreaction
Theory is cheap, so here is a realistic trade from start to finish. Most retail traders lose money trading EIA releases, and it is worth understanding why: the headline hits at 10:30:00, algorithms reprice the market within milliseconds, and the retail order arrives to trade against a price that already contains the news. The professional version of the trade is different – it fades the overreaction rather than chasing the headline.
Setup: Wednesday’s report shows a surprise crude build of 6 million barrels against consensus of minus 1 million. WTI drops $1.80 in twenty minutes, breaking below $74 support on enormous volume. But the details are less bearish than the headline: the build came from a spike in imports (lumpy, mean-reverting), refinery runs were down for seasonal maintenance (temporary), and gasoline drew hard (demand is fine). Cushing itself barely built. The market sold the headline; the report was actually neutral.
The trade: wait for the selling to exhaust – price stabilizing around $73.40 an hour after the release, volume fading, the front spread refusing to weaken further. Buy one Micro WTI at $73.50 with a stop at $72.90 (60 cents, $60 risk on a micro – within a 1% risk budget on a $10,000 account) and a target back above the broken level at $74.70 ($120, a 1:2 risk-reward). Thesis invalidation is clear: if the market keeps selling a neutral report through $72.90, the market knows something you don’t, and the stop takes you out for a survivable loss.
Note what did the work: reading the report’s internals rather than the headline, waiting for flows to exhaust instead of reacting, sizing off the stop, and defining invalidation in advance. The direction call was almost the least important part. That is what process means, and it transfers to every setup in this market.
Seasonality: The Calendar’s Edge
Crude has a demand calendar and a maintenance calendar, and both leave fingerprints on prices. Winter heating demand supports the first quarter; spring refinery turnarounds soften crude buying in April and May; the summer driving season between Memorial Day and Labor Day supports gasoline and, through it, crude; autumn brings the second maintenance lull; December trades OPEC year-end politics and positioning. Hurricane season (June through November) adds an asymmetric wildcard: a major Gulf storm can shut offshore production and refining simultaneously, moving crude and products in opposite directions.
Treat seasonality as a prior, not a signal. It tilts the odds; it does not overrule a supply shock or a demand collapse, and the years when the pattern fails are exactly the years something more important is happening. Seasonal patterns are also far stronger in natural gas, where weather is most of the demand story – our natural gas trading guide covers that market’s very different rhythm.
Geopolitics: The Permanent Wildcard
Oil is the most geopolitically sensitive market in the world because so much supply sits in politically complicated places. The market prices this continuously as a risk premium – extra dollars per barrel for the probability of disruption – that inflates during crises and evaporates during calm. Roughly a fifth of the world’s petroleum transits the Strait of Hormuz, which is why tensions there (most recently in spring 2026) move prices within minutes even when no barrel is actually stopped. Sanctions on Iran, Venezuela and Russia have made compliance and cargo-tracking a trading discipline of their own, and OPEC+ politics sit permanently underneath everything – the cartel’s quota decisions, compliance rates, and spare-capacity math are the market’s supply-side operating system.
Two practical rules. First, supply scares mean-revert unless barrels actually disappear: the 1990 template – spike, then full retracement – has repeated for thirty years, and buying the third day of a headline rally is historically a poor trade. Second, when barrels do disappear (Libya 2011, Russia 2022), the repricing is fast, brutal, and persistent – so the skill is telling the difference, not having an opinion. For the full framework on cartel behavior, quota mechanics, and spare capacity, see how OPEC controls oil prices.
Common Mistakes That Sink New Oil Traders
Oversizing. The leverage that makes futures efficient makes normal volatility lethal at the wrong size. Most blown accounts die of position size, not bad analysis.
Trading the news at the news. By the time you read the OPEC headline, the algorithms have traded it. Your edge is in the day-after repricing and the details the machines misread, not the millisecond race.
Ignoring the curve. Buying “cheap oil” via ETFs in steep contango, holding futures into expiry week, forgetting the roll – curve illiteracy is the most expensive gap in retail oil trading.
Fighting OPEC+ on conviction. The cartel controls the marginal barrel. You can profitably disagree with the market; disagreeing with the entity that controls spare capacity is a different proposition.
Averaging into leveraged losers. Works occasionally in stocks. In futures, it is the shortest path from a losing trade to a margin call.
No written plan. If entries, stops, sizing and invalidation are not written down before the trade, they will be improvised during it – by the least rational version of you.
Building a Trading Plan That Survives Contact
A trading plan is the document that does your thinking before the market starts doing it for you. It should specify what you trade (markets, instruments, timeframes), when you trade it (setups defined precisely enough that a stranger could recognize them), how much you risk (per trade, per day, in total), and when you stop (after a defined drawdown, ahead of major events you have no edge in, when conditions leave your playbook). Pair it with a journal that records every trade – entry, exit, reason, emotional state – and review the journal monthly. Traders hate this advice because it is boring. It is also the most reliable edge on this page: the journal is where you discover that your “OPEC instinct” loses money and your boring inventory setups pay the bills.
One more habit worth stealing from the professionals: keep a one-page market state summary and update it weekly – curve shape (contango or backwardation, and is it steepening?), Cushing and total US inventories versus the five-year average, OPEC+ posture, managed-money positioning, and the next three calendar events. Five lines. When a trade idea contradicts your own summary, one of the two is wrong, and finding out which one before entry is the cheapest research you will ever do.
Getting Started: A Realistic On-Ramp
If you are new, sequence matters more than enthusiasm. Learn the mechanics first – contracts, margin, expiry, the curve. Paper trade for two or three months, not to prove you are profitable (paper results flatter everyone) but to build execution habits and test your plan’s logic. Go live with Micro contracts and money whose loss changes nothing about your life. Measure your first six months by process adherence, not P&L. Scale only when the sample size, not the adrenaline, says to. The full beginner’s sequence – brokers, account types, first trades, realistic expectations – is laid out in our roadmap on how to start trading oil.
The Road From Here
Crude oil trading rewards exactly what it appears to punish: patience, humility, and process. The market is deep enough that no one moves it alone, volatile enough that everyone gets paid to be right at the right time, and complex enough that the homework compounds. Nobody masters it from one page – but the map helps.
Go deeper where your interest leads: futures mechanics step by step, the WTI-Brent relationship, the global benchmark system, supply and demand analysis, and the beginner’s roadmap. Options strategies, technical analysis deep dives, and risk management field guides are on the publishing schedule. If your interests run beyond crude, the same desk-level treatment of the gas market starts with our natural gas trading guide. The oil market will still be here – volatile, liquid, and occasionally absurd – whenever you are ready to trade it well.