A few dozen ministers meet in Vienna, argue for an afternoon, and issue a communique. Brent moves three dollars. That, in miniature, is how OPEC controls oil prices: not by setting a price – it gave that up decades ago – but by managing how many barrels its members put on the water. When the group withholds supply credibly, prices rise. When discipline cracks, they collapse, sometimes spectacularly. Every energy trader needs a working model of which of those two states the cartel is in, because it is the single largest recurring driver of crude prices and it sits upstream of everything covered in our complete guide to crude oil trading.
This is a long piece, deliberately. OPEC rewards study: the quota machinery, the compliance games, the Saudi spare-capacity backstop, and the four great price wars all follow patterns that repeat. Learn them once and you will read the next Vienna meeting better than most of the market.
Where OPEC’s Power Comes From: Members and Barrels
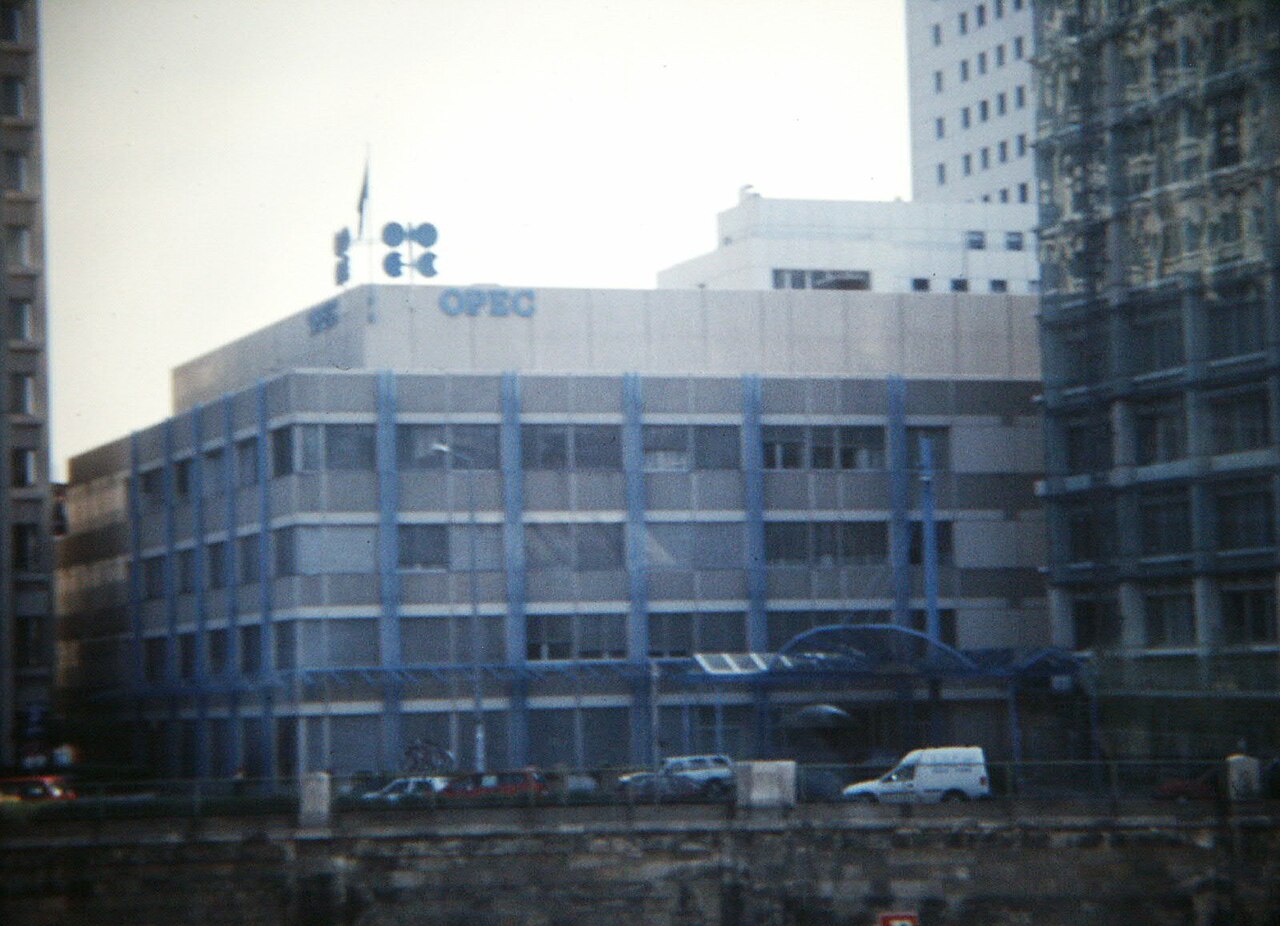
The Organization of the Petroleum Exporting Countries was founded in Baghdad in September 1960 by five countries – Saudi Arabia, Iran, Iraq, Kuwait and Venezuela – as a response to the Seven Sisters unilaterally cutting the posted prices on which producer-state royalties were calculated. It has been headquartered in Vienna since 1965. Membership has churned over the years: Qatar left in January 2019 to focus on LNG, Ecuador quit in January 2020, Indonesia suspended its membership in 2016, and Angola walked out in January 2024 after a dispute over its quota baseline. The biggest rupture came in April 2026, when the UAE – by then OPEC’s second-largest producer by capacity – announced it was leaving both OPEC and OPEC+ effective May 1, 2026, to expand production on its own terms.
That leaves 11 members today. Note who is actually on the list – the Republic of the Congo is a member; Ecuador, despite appearing in plenty of stale articles, is not.
| Member | Approx. crude output | Desk notes |
|---|---|---|
| Saudi Arabia | ~9-10 million bpd | De facto leader; only member with meaningful spare capacity |
| Iraq | ~4-4.5 million bpd | Chronic quota over-producer; watch Kurdish export disputes |
| Iran | ~3 million bpd | Sanctioned; exempt from quotas, so a wildcard on both sides |
| Kuwait | ~2.5 million bpd | Reliable compliance, rarely surprises |
| Nigeria | ~1.3-1.5 million bpd | Persistently under quota on theft and underinvestment |
| Libya | ~1-1.2 million bpd | Exempt from quotas; output swings with militia politics |
| Algeria | ~0.9 million bpd | Mature fields, declining slowly |
| Venezuela | ~0.7-0.9 million bpd | Exempt; collapsed from ~3 million bpd in the late 1990s |
| Congo | ~0.25 million bpd | Minor producer |
| Gabon | ~0.2 million bpd | Minor producer |
| Equatorial Guinea | ~0.05-0.1 million bpd | Smallest member |
Three of the twelve – Iran, Libya and Venezuela – are exempt from quota obligations because sanctions or internal chaos already constrain them. That matters for traders: any recovery in exempt-country supply adds barrels the quota system does not offset, and any further loss tightens the market without OPEC lifting a finger.
From Baghdad to OPEC+: A Short History of the Cartel
You cannot read OPEC’s present behavior without its past, because the ministers themselves are haunted by it. The compressed version:
- 1960-1972: A negotiating club with little price power. Oil traded under $3 a barrel.
- 1973: The Arab members’ embargo turns oil into a geopolitical weapon and roughly quadruples prices. More on this below.
- 1979-1981: The Iranian revolution and the Iran-Iraq war spike prices toward $40 – about $150 in today’s money – and trigger a demand response OPEC spends a decade regretting.
- 1982: Formal production quotas introduced for the first time as demand shrinks and North Sea supply grows.
- 1985-1986: Saudi Arabia abandons the swing-producer role, floods the market, and prices collapse below $10.
- 1998-2008: From the Asian-crisis lows near $10 to the China-boom peak of $147 in July 2008.
- 2014-2016: The market-share war against US shale. Brent goes from $115 to $27.
- December 2016: The Declaration of Cooperation creates OPEC+, bringing Russia and other non-members into the quota system.
- 2020: A Saudi-Russian price war collides with COVID; WTI prints negative; OPEC+ responds with the largest coordinated cut in history.
- 2022-present: The era of “voluntary cuts” layered on group quotas, gradually unwound as the group tries to reclaim market share without crashing the price.
Notice the rhythm: discipline, reward, cheating, collapse, renewed discipline. OPEC’s history is a cycle, not a line, and traders who assume the current phase is permanent get hurt at the turn.
Two of those episodes deserve a longer look than a bullet allows. The 1979-81 shock is the cleaner cautionary tale: OPEC did not engineer it – revolution and war did – but members happily sold into $40 crude, and the result was the deepest demand destruction in oil history. Global consumption fell for four consecutive years as consumers bought diesels, utilities switched to coal and nuclear, and efficiency standards bit. It took nearly a decade for demand to recover its 1979 peak. Every OPEC minister since has had that chart in a drawer: price spikes are borrowed prosperity, repaid with interest in lost demand.
OPEC+: The Expanded Cartel
The December 2016 Declaration of Cooperation was OPEC’s answer to a problem it could no longer solve alone: shale had made the 12 members too small a share of supply to move prices by themselves without sacrificing more market share than the price gain was worth. The fix was to recruit the biggest non-member producers into the quota system, most importantly Russia, alongside Kazakhstan, Mexico, Oman, Azerbaijan, Bahrain, Brunei, Malaysia, Sudan and South Sudan.
Together the roughly two dozen OPEC+ countries account for about 40 percent of global crude production – global supply runs around 105 million barrels per day – and a considerably larger share of seaborne exports, which is what actually sets marginal prices. The alliance is a marriage of convenience, not a merger. Russia’s compliance has always been looser than Riyadh’s, its production data murkier, and its incentives different: Russian oil companies, unlike Gulf national oil companies, answer partly to their own balance sheets. When you model OPEC+ decisions, model Saudi Arabia and Russia separately and assume everyone else mostly follows.
One more structural point before moving on: OPEC+ obligations are political commitments, not contracts. There is no enforcement mechanism beyond peer pressure, published compliance tables and the implicit Saudi threat to stop carrying free-riders. That is why the alliance holds together in bear markets, when hanging separately is the alternative, and frays in bull markets, when every incremental barrel is pure profit and the temptation to cheat peaks. Position accordingly: OPEC+ cohesion is itself cyclical, and it is weakest exactly when prices are strongest.
How OPEC Controls Oil Prices Day to Day: The Quota Machinery
The public sees a headline number. Underneath it sits a surprisingly bureaucratic machine, and each moving part is tradeable.
The Conference and the Committees
The OPEC Conference – all member-country oil ministers – is the supreme decision-making body. It meets at least twice a year, ordinarily around June and end-November/early-December, plus extraordinary sessions when the market forces the issue. Decisions formally require unanimity, which is why so many meetings end in artfully vague language: a communique that every minister can sign is often one that commits nobody to much.
Between conferences, two bodies do the real monitoring. The Joint Technical Committee (JTC) crunches supply-demand and inventory data. The Joint Ministerial Monitoring Committee (JMMC) – co-chaired in practice by Saudi Arabia and Russia – reviews compliance roughly every two months and can recommend, though not decree, adjustments. JMMC dates matter almost as much as full ministerial meetings; check the calendar on opec.org before positioning around month-end.
Quotas, Baselines, and the Games Around Them
Each participating country gets a production target derived from a negotiated baseline. The dirty secret is that the baseline fight matters more than the cut itself: a country that negotiates an inflated baseline can “cut” on paper while producing flat out. The UAE won a higher baseline in 2023 after a public standoff; Angola quit in January 2024 rather than accept a lower one. When you read a headline cut number, always ask: cut from what?
As of this writing the arithmetic stacks up in three layers, and the structure matters more than the precise decimals, which shift with each meeting:
- A group-wide OPEC+ production target – the widely cited figure has been 39.725 million bpd for the alliance as a whole. This is an OPEC+ number, not a target for the 12 OPEC members alone, a distinction plenty of commentary gets wrong.
- Group cuts agreed by all quota-bound members, roughly 3.7 million bpd at their peak.
- Additional “voluntary” cuts of about 2.2 million bpd announced by a subset of eight countries led by Saudi Arabia – the tranche the group began phasing back in during 2025, with each monthly increment announced, delayed or accelerated depending on prices.
Combined, the cuts peaked near 5.9 million bpd of withheld supply – roughly 5 percent of world production held off the market on purpose. That is the whole mechanism in one number. Whether it works depends on two things: compliance, and what non-OPEC supply does in response. Both are covered below, and both connect directly to the inventory math in our guide to oil supply and demand fundamentals.
Compliance: Trust, but Verify with Tankers
OPEC does not trust members’ self-reported production, and neither should you. The organization tracks output via “secondary sources” – a panel of price-reporting agencies and consultancies – and the market supplements that with tanker-tracking data from firms watching ship transponders and storage satellites. Historical compliance across the group has tended to run in the 70-90 percent range depending on the period, with a consistent cast of characters: Saudi Arabia typically delivers essentially all of its pledged cut, Iraq and Kazakhstan chronically overproduce, and Russia sits somewhere in between with data nobody fully believes.
The practical trading rule: discount announced cuts by the group’s recent compliance rate. A 2 million bpd headline cut with 75 percent expected compliance is a 1.5 million bpd cut. Sophisticated desks go member by member.
Reserves and Market Share: The Long Game
OPEC’s leverage is not just current production. By the organization’s own Annual Statistical Bulletin, its members hold on the order of 1.24 trillion barrels of proven reserves – close to 80 percent of the world total, though reserve bookings by national oil companies are audited lightly and deserve some skepticism. Even haircutting those figures, the concentration is real: the cheapest, largest undeveloped oil on earth sits overwhelmingly inside OPEC borders, with Gulf lifting costs commonly estimated in the single digits per barrel.
That reserve position creates an asymmetry traders should internalize. A Permian operator’s asset depletes in years, so it produces flat out whenever prices clear its breakeven. Saudi Arabia’s asset depletes in generations, so it can rationally leave barrels in the ground to defend price – or flood the market for a year to defend share – and still be the last producer standing either way. OPEC plays a longer game than any of its competitors, which is precisely why its short-term moves are credible.
Saudi Arabia: The Swing Producer
Inside the cartel, one member matters more than the other eleven combined. Saudi Arabia holds roughly 267 billion barrels of reserves, produces near 9-10 million bpd, and – uniquely – maintains around 3 million bpd of genuine spare capacity that can be brought online within weeks. Nobody else in the world keeps that much productive capacity idle on purpose. It is expensive insurance, and it is the foundation of Saudi power.
Spare capacity works on prices in both directions. It caps rallies, because the market knows Riyadh can flood any spike; and it credibly threatens cheaters, because the kingdom can start a price war it knows it can outlast – production costs at Ghawar and its sister fields are among the lowest on earth. Saudi Arabia has also historically shouldered the largest share of voluntary cuts, at times restraining well over 2 million bpd of its own output, which is why the market treats Saudi statements as policy and everyone else’s as commentary.
The burden chafes, though. Every barrel Saudi Arabia withholds is revenue foregone while Iraq quietly overproduces, and the kingdom’s fiscal breakeven – the oil price that balances its budget, commonly estimated well above its production cost, in the $80-100 region depending on the year – pulls policy toward defending price. When Riyadh signals it is tired of carrying under-compliant partners, take it seriously. That fatigue preceded both the 1985 and 2020 price wars.
OPEC vs. US Shale: The Cartel’s Dilemma
Shale broke OPEC’s old playbook. Conventional megaprojects take five to ten years from sanction to first oil; a shale well produces within months of spudding and declines steeply within two years. That makes US supply the fastest-responding barrel in the market – effectively a competing swing producer, except that it responds to price rather than to policy.
This hands OPEC a dilemma with no clean answer. Defend price with cuts, and every dollar of the rally finances more Permian drilling that eats the cartel’s market share. Defend share by pumping, and prices fall on everyone, including members whose budgets bleed below $80. The 2014-2016 experiment showed the second path is agony: OPEC declined to cut in November 2014, Brent collapsed from $115 to $27, US production eventually dipped – and then came roaring back the moment prices recovered, leaner and cheaper than before. Shale producers hedged forward and survived; several OPEC treasuries nearly did not.
Since 2016 the revealed strategy has been to defend price and tolerate shale growth, on the logic that moderate prices with smaller volumes beat low prices with slightly larger ones. The equilibrium is rough but observable: sustained prices much above $85-90 accelerate US drilling and eventually force OPEC to concede share, while prices below $60 idle rigs within months and quietly do OPEC’s supply management for it. The band drifts with shale’s costs, which is why serious OPEC-watchers track Baker Hughes rig counts and Permian breakevens as closely as Vienna communiques.
Four Price Wars: What History Teaches About OPEC’s Power
OPEC’s limits are best learned from the episodes when its control failed or was weaponized. Four case studies carry most of the lesson.
1973: The Embargo
During the October 1973 Arab-Israeli war, the Arab members of OPEC embargoed exports to the United States and other countries supporting Israel and cut production month over month. The posted price of Gulf crude roughly quadrupled, from about $3 to nearly $12 per barrel, in a matter of months. Gas lines formed across the US, Western economies tipped into stagflation, and oil became a strategic weapon in the public imagination. Two durable consequences followed: consuming countries founded the International Energy Agency and built strategic petroleum reserves, and a decade of high prices triggered efficiency gains and non-OPEC exploration – the North Sea, Alaska, Mexico – that would come back to bite the cartel in the 1980s. Lesson one: OPEC can spike prices at will, but the spike plants the seeds of the next glut.
1985-1986: The Netback War
Through the early 1980s Saudi Arabia played swing producer alone, cutting its own output from around 10 million bpd toward 2.5 million bpd by mid-1985 while other members cheated and non-OPEC supply grew. In late 1985 Riyadh gave up: it switched to netback pricing to win back refiners and pushed production sharply higher. Prices collapsed from around $30 to under $10 by mid-1986. The episode nearly bankrupted several members – and Houston too – but it re-established the credibility of the Saudi threat. Lesson two: the swing producer will not absorb everyone else’s cheating forever, and when it stops, the floor is much lower than consensus thinks.
2014-2016: The Shale Test
Facing surging US output, OPEC met on 27 November 2014 and, at Saudi urging, declined to cut. The strategy was explicit: let low prices force high-cost shale out. Brent fell from $115 in June 2014 to $27 by January 2016. US production did decline – but only by about 1 million bpd, and hedging plus rapid cost deflation let shale survive far longer than Riyadh expected. Meanwhile Venezuela, Nigeria and Libya slid into fiscal crisis. OPEC capitulated in late 2016 with the Algiers accord and the Declaration of Cooperation that created OPEC+. Lesson three: OPEC cannot price a competitor out of the market when that competitor’s cost curve is falling; it can only rent time.
2020: The Price War That Met a Pandemic
In early March 2020, with COVID demand losses already visible, Russia refused Saudi proposals for deeper cuts. Riyadh responded by slashing its official selling prices and signaling maximum production – a price war launched into a collapsing market. Demand fell by tens of millions of barrels per day within weeks as lockdowns spread. Storage filled. On 20 April 2020, the expiring May WTI contract settled at minus $37.63 a barrel as longs with no storage paid to escape delivery at Cushing – the most violent demonstration on record that when storage binds, price has no floor. (We walk through the mechanics of that print in the crude oil benchmarks guide, because it was as much a WTI-delivery-mechanism story as an OPEC story.)
Twelve days earlier, OPEC+ had already blinked: the 12 April 2020 agreement cut 9.7 million bpd – about 10 percent of world supply, the largest coordinated cut ever – with the US, uniquely, jawboning the deal together. Prices recovered through 2021 and spiked past $100 after Russia invaded Ukraine in 2022. Lesson four, in two parts: no cartel can out-cut a demand collapse in real time; but a sufficiently large coordinated cut, held long enough, can drag a market out of the deepest glut in history inside eighteen months.
How OPEC Decisions Hit the Futures Curve
Spot headlines get the attention; the term structure carries the information. OPEC supply management shows up along the whole futures strip, and reading it correctly separates professionals from tourists.
When OPEC withholds supply into firm demand, inventories draw and the market pays a premium for prompt barrels: the curve moves into backwardation, with near months above deferred. When OPEC opens the taps – or demand rolls over – inventories build and the curve flips into contango, near months at a discount deep enough to pay storage and financing for whoever carries the surplus. Get the direction straight: builds mean contango, draws mean backwardation. In April 2020 the twelve-month WTI contango blew out beyond $10 – the “super-contango” that made chartering a VLCC just to store crude a profitable trade.
Practically, this means an OPEC cut announcement often moves calendar spreads more reliably than flat price. Flat price has to fight macro flows and dollar moves; the front spread is a purer read on barrels versus storage. Watching the Brent spreads on ICE (symbol B) and WTI spreads on CME/NYMEX (CL, 1,000 barrels per contract) around meeting dates will teach you more about the market’s verdict on an OPEC decision than any headline. Note that OPEC decisions transmit to Brent first – the cartel’s barrels price against seaborne benchmarks – and reach WTI through the Atlantic arbitrage.
Trading OPEC Meetings Without Getting Run Over
Meeting days are among the highest-volatility scheduled events in crude. They are also where a lot of retail money goes to die, usually the same way: positioned for the headline, blind to what was already priced in.
Before the Meeting
In the one to three weeks ahead of a conference, the market builds a consensus from ministerial comments, JMMC leaks and analyst notes. Implied volatility on short-dated options rises; flat price drifts toward the expected outcome. By meeting day, the consensus cut or increase is usually fully priced. Your edge, if you have one, is in the distribution around consensus – the odds of a surprise extension, a compliance blow-up, or a baseline fight leaking into the open.
On the Day
The reaction function is about the gap between outcome and expectation, not the outcome itself. A 1 million bpd cut the market expected can sell off; “no change” can rally if whispers had turned bearish. Three practical rules from hard experience. First, never hold a leveraged directional position into the announcement on the assumption the communique is knowable – delegates leak selectively and deliberately. Second, beware the first headline: initial algo moves of 2-4 percent frequently retrace once the details (baselines, duration, exemptions) hit the tape. Third, the press conference matters as much as the statement – a defensive Saudi minister walking back the group’s resolve has reversed more than one initial rally.
After the Meeting
The durable trade is usually the slower one: position for the compliance data that arrives over the following two months via secondary-source estimates and tanker trackers. Announced cuts that are actually delivered grind spreads into backwardation over weeks. Announced cuts that members quietly ignore leak back out through the curve just as slowly. That window – after the volatility crush, before the data verdict – is where fundamental traders get paid.
Reading the OPEC Monthly Oil Market Report
OPEC publishes its Monthly Oil Market Report (MOMR) around the middle of each month, free on opec.org. It is both a data source and a signaling device, and you should read it as each in turn.
As data: the secondary-source production table is the closest thing to an official compliance scorecard, and the demand-growth and non-OPEC supply forecasts frame the balance the group believes it is managing. As signal: the editorial choices telegraph intent. When the MOMR revises demand up and non-OPEC supply down, the cartel is building a public case that the market can absorb more OPEC barrels – often a prelude to unwinding cuts. When it dwells on inventory builds and macro risk, cuts are being justified in advance. Compare each MOMR against the IEA’s Oil Market Report and the EIA’s Short-Term Energy Outlook, published the same week: the OPEC-IEA demand-forecast gap has at times exceeded a full million barrels per day, and how that gap closes is itself a tradeable question.
The Hard Limits on OPEC’s Control
For all the machinery above, OPEC’s control has boundaries, and most bad OPEC trades come from forgetting them.
- It cannot control demand. Recessions, pandemics and price-driven demand destruction overwhelm supply management. 2008 and 2020 both proved it.
- It cannot beat the shale response for long. Sustained high prices summon non-OPEC barrels within quarters, not decades.
- It cannot fully police its members. Cheating is structural: every member’s individual incentive is to free-ride on everyone else’s cuts.
- It cannot manage geopolitics. Wars, sanctions and strikes hit member production regardless of quota math. Red Sea shipping attacks, Iranian sanctions rounds and Libyan port blockades all move prices outside the cartel’s control – sometimes in its favor, sometimes not.
- It cannot set the price of the marginal barrel alone. Roughly 60 percent of world supply answers to markets, not ministers.
A useful rule of thumb from the academic literature: because short-run demand elasticity for oil is tiny, removing 1 million bpd from a balanced market tends to move prices by several dollars a barrel – but the same inelasticity works in reverse when OPEC adds barrels into weakness. The cartel’s lever is powerful precisely because the demand curve is steep, and dangerous to its members for the same reason.
OPEC and the Energy Transition
The long-term threat to OPEC is not shale but the demand curve itself. EV adoption, efficiency and fuel substitution put peak oil demand somewhere between 2030 and the 2040s depending on whose forecast you believe – OPEC’s own outlook is, unsurprisingly, the most bullish on demand. Members are responding in character: Saudi Arabia’s Vision 2030 pours oil revenue into diversification, petrochemicals and tourism; the UAE – now outside OPEC entirely – expands capacity to monetize reserves faster while they are worth something; poorer members with no fiscal cushion simply pump what they can.
Here is the paradox worth carrying into the 2030s: a shrinking market may concentrate OPEC’s power rather than dilute it. If high-cost non-OPEC supply exits first as demand declines, the lowest-cost producers – the Gulf core – end up with a larger share of a smaller market. Whether that residual pricing power is worth much with lower volumes is the trillion-dollar question hanging over every member’s budget. Natural gas faces a different version of the same transition question, which is one reason the parallels in our natural gas trading guide are worth studying – gas has no cartel, and the price behavior differences are instructive.
Transmission Mechanics: How a Vienna Decision Becomes a Price
It is worth walking through the plumbing, because the lag between announcement and physical effect is where markets misprice. A quota decision does not change a single physical flow on the day it is announced. What happens next, step by step:
- Week 0: The communique lands. Futures reprice expectations instantly; physical flows have not moved a barrel.
- Weeks 1-2: National oil companies publish official selling prices and notify term customers of allocation changes. Saudi Aramco’s OSP differentials – premiums or discounts against regional benchmarks for each customer region – are the first hard evidence of intent. A cut paired with aggressive OSP discounts to Asia is a cut in name only.
- Weeks 3-6: Loading programs for the following month are fixed. Tanker charters, port lineups and export schedules become visible to anyone paying for ship-tracking data, and the market starts marking announced barrels to observed barrels.
- Weeks 6-12: Cargoes arrive, refiners run them, and the change finally shows up in the inventory statistics – OECD stocks, US weekly data, floating storage. Only now does the cut exist in the data most traders watch.
That two-to-three-month pipeline explains a recurring pattern: prices pop on the announcement, fade as impatient longs see no immediate inventory effect, then grind higher once draws materialize – assuming compliance was real. Desks that understand the lag buy the fade; desks that do not sell the bottom of it.
The physical origin of OPEC pricing also explains benchmark behavior. Gulf exports price against Dubai and Brent-linked markers, so cuts tighten the seaborne market first: Brent structure firms, Dubai’s discount to Brent narrows, and WTI follows via export arbitrage rather than leading. When you see Brent backwardation steepening while WTI lags, the market is telling you the tightness is OPEC-made, not made in Texas.
Common Mistakes Traders Make Around OPEC
After enough meeting cycles, the same errors recur reliably enough to list.
- Trading the headline instead of the baseline. A “1.5 million bpd cut” measured against baselines nobody was producing at is not 1.5 million barrels of anything. Read the country-level table before believing the aggregate.
- Ignoring what was priced in. If crude rallied four dollars into the meeting on cut expectations, the cut is the consensus, and consensus outcomes get sold. The trade is in the surprise, not the event.
- Assuming compliance. Paper barrels are removed instantly; real barrels leak back over months. Position size should reflect delivered cuts, not announced ones.
- Confusing OPEC power with OPEC omnipotence. In a demand shock, cuts slow the bleeding but do not stop it. Buying crude on cut announcements into collapsing demand was a losing trade in 2008 and again in 2020.
- Forgetting the exempt members. A quota decision can be swamped by 500,000 bpd of Libyan restarts or a new round of Iranian sanctions enforcement. The balance moves on total supply, not quota-bound supply.
- Holding leveraged positions through the announcement. The intraday whipsaw on meeting days routinely runs several percent in both directions before settling. If your stop can be hit by noise, the meeting will find it.
Geopolitics Inside the Cartel: The Risk Premium OPEC Cannot Manage
A final layer traders must price separately: much of the world’s geopolitical supply risk sits inside OPEC’s own membership, and the cartel has no tool for managing it. Quotas assume production capacity is a policy choice. For several members it is not.
Iran’s exports swing with sanctions enforcement and regional escalation; every episode of Gulf tension revives the Strait of Hormuz question, since a large share of global seaborne crude – on the order of a fifth of world supply – passes through that single chokepoint. Libya’s output has repeatedly gone from over a million barrels a day to a few hundred thousand and back within months as ports are blockaded and reopened. Venezuela’s decline was a slow-motion supply cut larger than most OPEC agreements, delivered by mismanagement rather than ministers. Iraq’s northern exports have been hostage to Baghdad-Erbil pipeline disputes for years at a stretch.
The market prices this as a risk premium layered on top of the fundamental balance – a few dollars in calm periods, $10-15 or more when tankers are being attacked or facilities hit. The premium is mean-reverting in a way fundamentals are not: it compresses quickly when feared disruptions fail to materialize. Distinguishing premium from balance is one of the most valuable skills in crude trading, and the cleanest way to build it is to keep an independent estimate of where inventories say price should be, then treat the residual as the market’s fear gauge. When the residual is large and the tankers keep sailing, fading it has historically been a profitable – if white-knuckled – trade.
What to Actually Watch: A Trader’s Checklist
- The meeting calendar – full ministerials and JMMC sessions, from opec.org.
- Voluntary-cut unwind announcements – the monthly increments, delays and accelerations are the live policy signal.
- Secondary-source production tables in each MOMR – the compliance scorecard.
- Saudi official selling prices (OSPs) – the monthly differentials to Asia are a read on how hard Riyadh is fighting for market share.
- Spare capacity estimates – a market with thin spare capacity prices supply risk violently; a cushioned market shrugs off headlines.
- Calendar spreads around meetings – the curve’s verdict on whether cuts are real.
- Exempt-member supply – Iran, Libya, Venezuela barrels move the balance without any OPEC decision.
How OPEC controls oil prices, compressed to three sentences: it withholds supply through negotiated quotas backed by Saudi spare capacity, it enforces them imperfectly through monitoring and the standing threat of a price war, and it operates inside hard limits set by demand, non-OPEC supply and its own members’ cheating. The cartel is neither omnipotent nor irrelevant – it is a repeated game you can learn. Start with the supply-demand mechanics in our guide to how supply and demand drive oil prices, then put the pieces together in the complete crude oil trading guide.