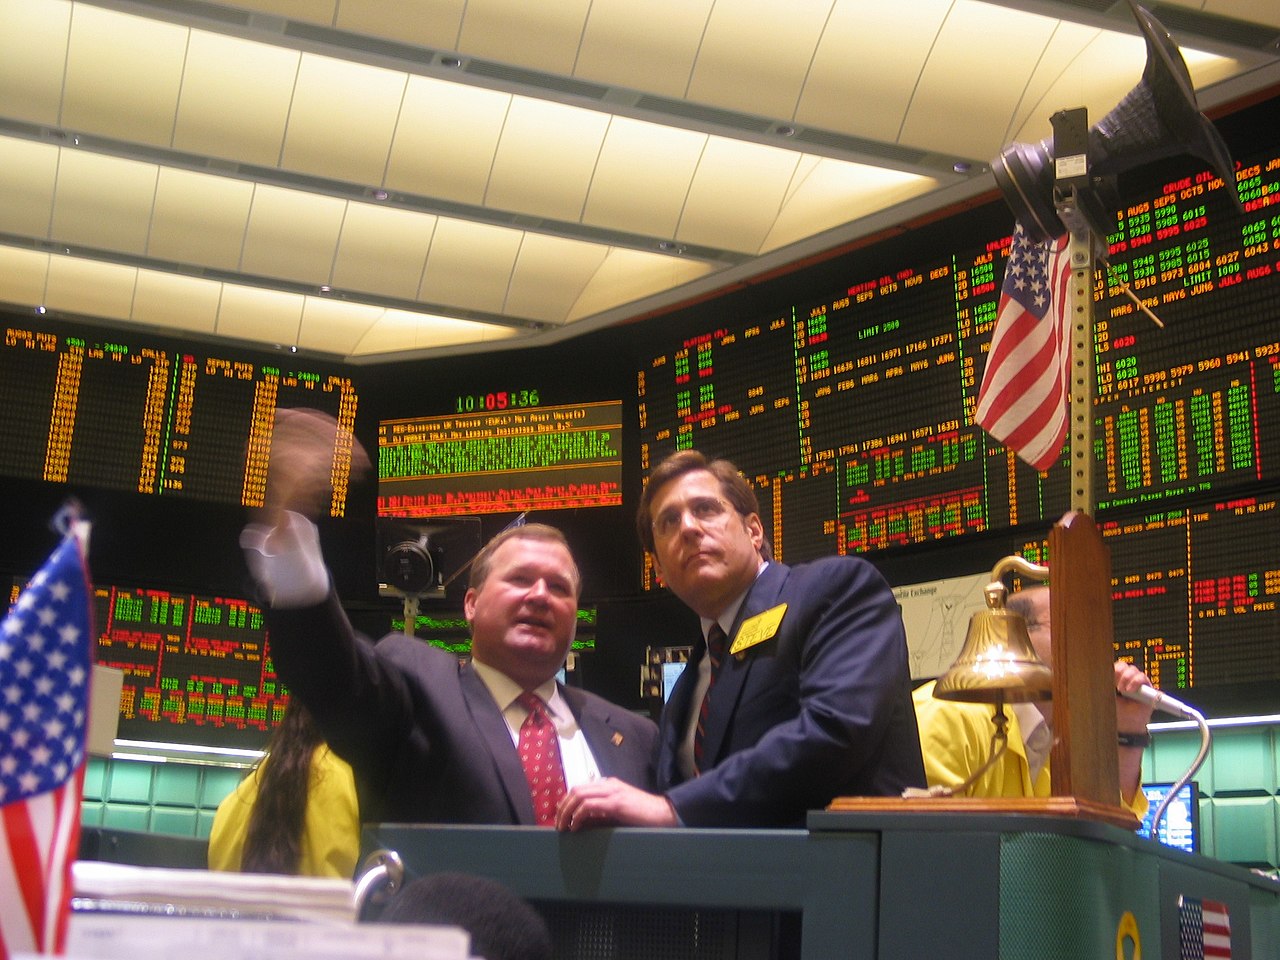
Every natural gas price you will ever see quoted in North America traces back to a fenced-in patch of pipe in Erath, Louisiana. Henry Hub pricing sets the value of NYMEX futures, anchors physical contracts from Alberta to the Gulf Coast, and — since the LNG boom — reaches into power bills in Tokyo and factory costs in Germany. Understanding how this one location came to price a continent’s gas is foundational; it underpins everything in our complete natural gas trading guide, and it is the first thing any new energy trader should get straight.
The short version: Henry Hub is where enough pipelines meet that the price discovered there reflects the whole continental balance rather than any local quirk. The long version is more interesting, and more useful.
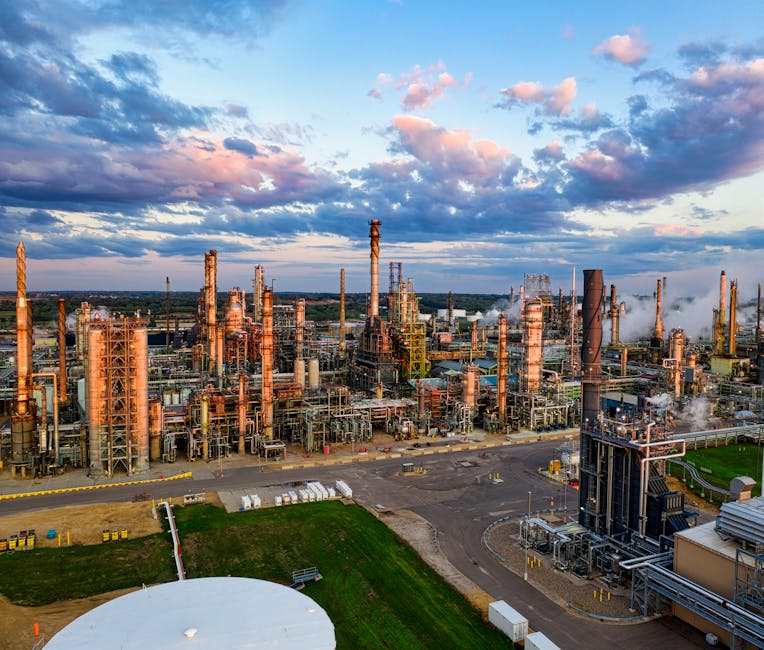
What Henry Hub Actually Is
Henry Hub is a physical interconnection point on the Sabine Pipe Line system near Erath, in Vermilion Parish, Louisiana — Cajun country, about 150 miles west of New Orleans. Roughly a dozen pipeline systems interconnect there (the usual count is nine interstate and four intrastate lines), letting gas flow in from producing regions and out toward consuming markets, storage fields, and the Gulf Coast LNG corridor.
That convergence is the entire secret. A benchmark works when buyers and sellers can actually perform there: a seller at Henry Hub has many routes to deliver gas, a buyer has many sources to receive it, and salt-dome storage nearby lets either side manage timing. No single pipeline outage or local demand swing dominates the price. Compare that with a one-pipe town in West Texas, where a single compressor failure can crater the local price — no basis for a national benchmark.
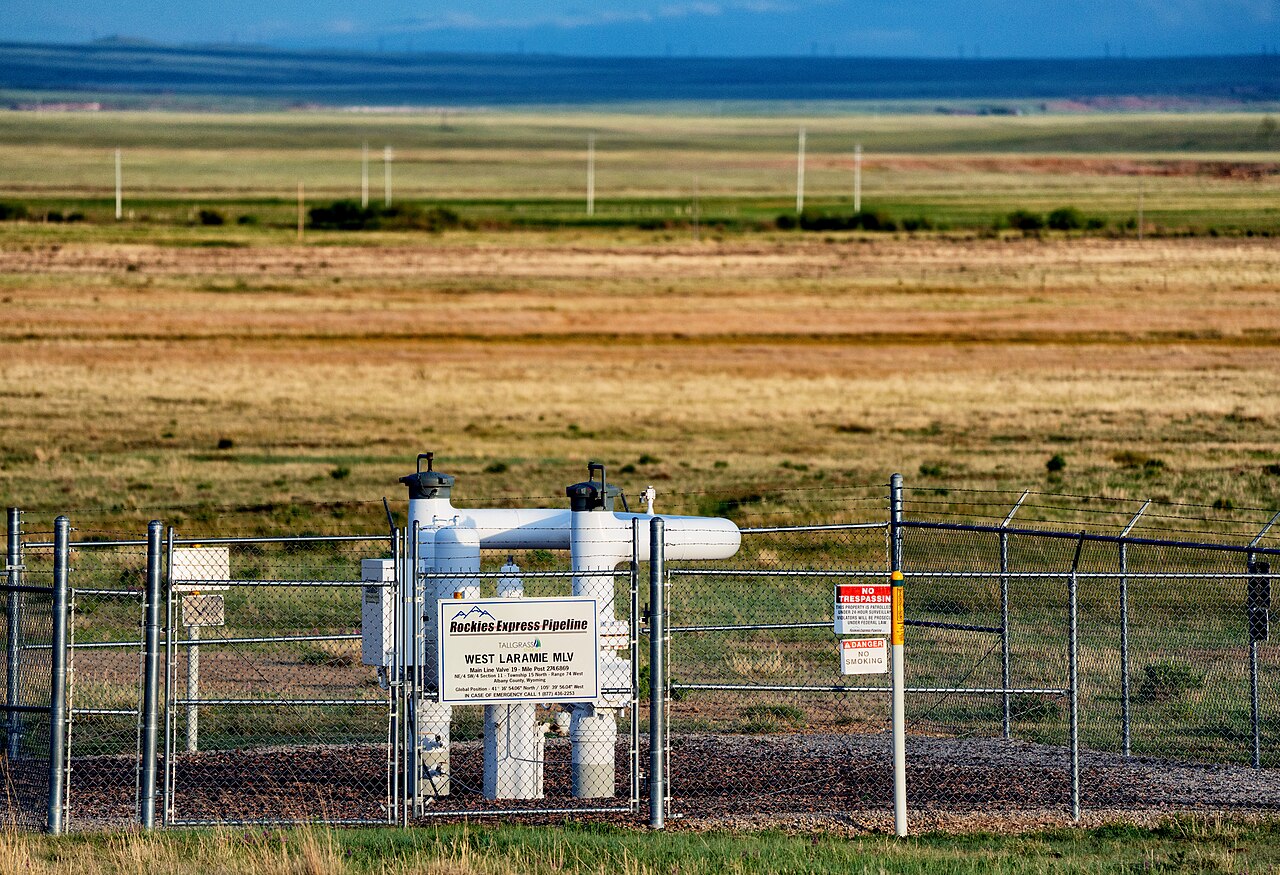
The site itself is anticlimactic: meters, valves, and interconnect piping operated by Sabine Pipe Line, with no trading floor in sight. It has weathered Gulf hurricanes, ownership changes, and three decades of market upheaval without losing its role, partly because the infrastructure around it kept growing — every new Gulf Coast LNG terminal and pipeline expansion deepens, rather than dilutes, the liquidity that meets at Erath.
How it became the futures delivery point
Until the 1980s there was no gas “market” to benchmark — prices were federally regulated. The Natural Gas Policy Act of 1978 started decontrol, FERC Orders 436 and 636 forced pipelines to unbundle transport from gas sales, and suddenly thousands of buyers and sellers faced floating prices with no hedging tool. NYMEX filled the gap in April 1990, launching a natural gas futures contract and choosing Henry Hub as its delivery point for exactly the reasons above: pipeline connectivity, proximity to Gulf Coast production, existing physical trading, and storage access.
The contract grew with deregulation through the 1990s, survived the Enron era, and is today one of the most liquid commodity futures in the world — 10,000 MMBtu per contract, physically delivered at the Hub. The full mechanics, including the E-mini and Micro versions, are covered in our guide to natural gas futures contract specifications.
How Henry Hub Pricing Works: The Basis System
Here is the mechanism that makes one hub price a continent. Physical gas everywhere else in North America is quoted as Henry Hub plus or minus a location differential, called basis:
Regional price = Henry Hub price + basis
Basis reflects what it costs — or what it is worth — to move gas between that location and the benchmark. Points with surplus supply and scarce pipeline takeaway trade at negative basis (a discount); points with strong demand and constrained delivery capacity trade at positive basis (a premium). The signs are not academic. Real-world patterns:
- Appalachia (Marcellus/Utica): chronically negative, often $0.30–$1.00 under Henry Hub. America’s biggest gas field has more supply than exit capacity.
- Waha (Permian, West Texas): the deepest discount in the country. Associated gas keeps flowing regardless of gas prices because producers are drilling for oil, and when pipelines fill, Waha has traded at zero and below — producers paying to get rid of gas.
- Chicago citygate: modest premium in winter, near flat otherwise — a big demand center with good pipeline access.
- New England (Algonquin citygate): the spike zone. Pipeline capacity into the region is capped, so deep cold sends local prices to $10–$30/MMBtu while Henry Hub barely blinks.
- Gulf Coast points: tight to the Hub, and increasingly bid by LNG terminal demand.
The system’s genius is hedging efficiency. A producer in Pennsylvania or a utility in Minnesota can hedge the big, volatile component of their price risk with liquid Henry Hub futures, then manage the smaller basis component separately with basis swaps. One deep pool of liquidity, instead of fifty shallow ones. If you have read our comparison of WTI vs Brent crude, the architecture rhymes: WTI performs the same anchor role at Cushing, Oklahoma — but oil’s benchmark spreads are measured in dollars while gas basis can be the whole story, because molecules of gas cannot take a ship across the continent.
Futures Liquidity: Where the Price Is Actually Discovered
The physical hub gives the benchmark legitimacy; the futures market gives it a price every second. NYMEX Henry Hub futures trade hundreds of thousands of contracts a day across producers hedging output, utilities locking winter supply, funds expressing macro views, and market makers knitting it together. That depth produces tight spreads, near-24-hour price discovery, and a forward curve extending years — the reference strip against which physical deals, storage economics, and power contracts are all valued.
Two quotes matter more than any others. The front-month futures price is the number on every terminal and news site. The spot (next-day) price at the Hub, assessed from physical trades and published daily by price reporting agencies and the EIA’s Henry Hub spot series, is what physical gas actually changed hands for. They track each other closely but are not identical — futures embed expectations; spot embeds today’s pipeline reality.
Monthly physical business adds a third number: during bidweek, the last few trading days of each month, buyers and sellers transact baseload supply for the coming month, and those deals settle against indexes derived from the expiring futures contract. When you hear that a futures contract “went off the board” at a certain price, that settlement just priced a month of physical commerce across the continent.
Reading the curve: contango and backwardation
The Henry Hub forward curve is permanently saw-toothed: winter months price above the summers that precede them, because storage costs money and winter demand is real. Within that shape, the market signals scarcity the usual way. When near months trade below deferred months (contango), supply is comfortable and the market pays for storage; when near months trade above deferred (backwardation), the market wants gas now and will not pay you to store it. A hard cold snap can flip the front of the curve from contango to backwardation in days — one of the cleanest tightness signals gas offers, and one worth checking before every positional trade.
2026 So Far: A Case Study in Seasonality
This year’s tape is a textbook illustration of how Henry Hub pricing behaves:
- January 2026: $7.72/MMBtu. An arctic outbreak drove heating demand and freeze-offs simultaneously; storage draws ran far above the five-year average.
- February 2026: ~$3.62. The cold broke, and gas gave back most of the spike within weeks — spikes die fast when supply is 100+ Bcf/d and price-responsive.
- Late March 2026: $2.88. Shoulder season: no heating load, no cooling load, injections beginning. The annual low zone.
A 63% collapse in two months with no crisis, no war, no hurricane — just the calendar. Traders who internalize this seasonality stop being surprised by it and start pricing it. Prices under $3 also sit near the economic floor: dry-gas drilling struggles there, so sustained weakness eventually cuts supply and rebuilds the next rally. The deeper mechanics of that feedback loop are laid out in our piece on natural gas supply and demand.
What Drives Henry Hub Prices
Weather, first and always
On any horizon under a month, temperature forecasts are the dominant input. Cold adds residential and commercial heating load plus power burn; heat adds air-conditioning power burn. A forecast revision of 15–20 population-weighted heating degree days is worth real money, and the market reprices it within minutes of each major model run. Note the asymmetry: winter cold moves the benchmark far more than summer heat, because heating demand per degree dwarfs cooling demand per degree.
Storage as the shock absorber
US working gas storage — roughly 1,200 Bcf at winter’s end, ~3,800–3,900 Bcf at the November peak in a normal year — buffers the mismatch between steady production and seasonal demand. The market grades each Thursday’s EIA storage number against consensus and the five-year average, and the deviation drives the reaction. Deficits embolden bulls into winter; surpluses cap every summer rally. Storage is also why gas prices mean-revert most of the time: inventory absorbs ordinary shocks, and only extraordinary ones (Uri, 2022) break through.
Production: the long shadow of shale
US dry gas production has climbed from ~50 Bcf/d in 2005 to over 100 Bcf/d — the structural reason Henry Hub spent most of the 2010s and 2020s far below its 2008 peaks. Supply responds to price with a lag measured in months: sub-$2 stretches in 2024 forced curtailments; $4+ reliably wakes the Haynesville rig count. That elasticity caps how long extreme prices persist in either direction.
LNG exports: the swing demand
Export terminals now pull around 19–20 Bcf/d of feedgas at full run — demand that competes directly with domestic consumers and links Henry Hub to world prices. When European or Asian prices spike, terminals run flat-out and Henry Hub firms; when a terminal trips offline, its feedgas floods back into the domestic balance within hours. The June 2022 Freeport explosion remains the canonical example: bearish for Henry Hub, bullish for Europe, simultaneously.
Rank these drivers by horizon and the market stops looking chaotic: weather owns the next two weeks, storage owns the season, production economics own the year, and LNG buildout owns the decade. Most bad gas analysis comes from applying a driver at the wrong horizon — citing rig counts to explain a Tuesday rally, or a cold snap to justify a three-year price deck. Match the driver to the timeframe of your trade and half the noise disappears.
A Worked Example: Hedging Production with Henry Hub Futures
Abstract benchmarks become concrete the first time you hedge with one. Take a mid-size Haynesville producer selling 10,000 MMBtu/day — conveniently, one NG futures contract per day of production.
It is June. The January futures contract trades at $4.20, and the producer’s board wants winter cash flow locked. The producer sells 31 January contracts (one per delivery day). Two outcomes:
- Cold winter — January spot spikes to $7.00. The futures position loses $2.80/MMBtu, but the physical gas sells for $7.00 locally. Net realized: about $4.20 plus or minus basis. The producer “missed” the rally — and made budget, which is the job.
- Mild winter — spot collapses to $2.50. Futures gain $1.70, physical sells cheap, net again about $4.20. The hedge just paid for the drilling program.
The residual risk is basis: the producer sells gas in Louisiana, not at the Hub itself, so if the local differential moves 10–20 cents against them, the hedge is imperfect by that amount. Producers who care lock that too, with basis swaps. Now scale this picture up: hundreds of producers, utilities doing the mirror-image hedge on the buy side, funds taking the other side of both — that is where the liquidity in Henry Hub futures comes from, and why the benchmark’s price discovery is trusted. Speculators are renting the risk that hedgers pay to shed.
Basis Trading: The Professional’s Second Market
Once you can read Henry Hub, basis differentials become a market of their own. Basis swaps and futures trade the spread between a regional hub and Henry Hub directly, and the trades are refreshingly physical in logic:
- Pipeline capacity bets. A new pipeline out of a constrained basin narrows the local discount. Traders who mapped Permian takeaway capacity against production growth saw Waha’s collapses coming quarters ahead — the pipeline schedule was public information.
- Winter reliability bets. Long New England winter basis is effectively a bet on cold plus constrained pipes. It pays like insurance underwriting in reverse: small losses most years, a monster payout in an Algonquin blowout.
- Event dislocations. Freeze-offs, hurricanes, and compressor failures move local prices violently while Henry Hub yawns. During Winter Storm Uri in February 2021, some mid-continent hubs printed spot prices in the hundreds of dollars per MMBtu — against a futures benchmark that peaked near $3.30 that month. The traders and utilities who confused “hedged at Henry Hub” with “hedged” learned the difference in bankruptcy court.
Retail platforms rarely offer basis products, and that is probably for the best. But even a pure futures trader should watch a few regional prints daily: basis is where physical stress appears first, and the benchmark usually follows.
Common Misconceptions About Henry Hub Pricing
Three errors show up constantly, even in otherwise decent commentary:
- “Henry Hub is the price of US gas.” It is the benchmark, not the average. On a cold January day the volume-weighted price Americans actually pay diverges enormously — New England utilities might pay five times the Hub while Waha producers collect a third of it. The benchmark is the reference point for that dispersion, not a summary of it.
- “The futures price predicts the future spot price.” The forward curve is today’s price for future delivery — storage costs, hedging flows, and risk premia included — not a forecast. January futures at $4.50 in June does not mean the market “expects” $4.50 in January; winter contracts systematically carry a weather-risk premium that usually (not always) erodes as reality arrives. Entire strategies exist just to harvest or avoid that premium.
- “Global gas prices converge to Henry Hub.” They anchor to it loosely, through the LNG arbitrage channel, with a $2–3 liquefaction toll plus shipping in between — and only when export capacity is unconstrained. 2022 proved how far and how long the tethers can stretch.
A fourth, subtler one: treating the Hub’s calm as safety. Because Henry Hub is the most liquid, most buffered point on the continent, it is usually the least volatile gas price in America. The risk in gas hides in the basis, the calendar spreads, and the tails. The benchmark’s stability is the product of infrastructure, not proof that the commodity is tame.
Paper vs. Molecules: How Much Gas Actually Trades at Henry Hub?
Here is the part that surprises newcomers: the physical hub is small relative to its shadow. The pipes at Erath schedule a modest slice of the continent’s daily flows, and only a tiny fraction of futures contracts — well under 1% — ever go to physical delivery. Nearly everyone closes or rolls before expiry; the delivery mechanism exists mostly as the threat that keeps futures and physical prices honest with each other. If futures drifted away from the physical market, arbitrageurs could stand for delivery and profit, so the gap never opens wide.
Multiply it out and the paper market dwarfs the molecules: hundreds of thousands of contracts a day at 10,000 MMBtu each represents multiples of total US production changing hands daily in futures alone, before counting options, swaps, and basis products layered on top. That ratio is not a scandal — it is what benchmark status looks like. Deep speculative and hedging volume is precisely what lets a producer sell 31 January contracts at 2 a.m. without moving the price. The molecules give the number meaning; the paper gives it liquidity. A good benchmark needs both, and Henry Hub is the rare hub that kept both for thirty-five years.
Henry Hub vs. TTF and JKM: The Global Benchmarks

Gas has no single world price — it has three regional benchmarks stitched together by LNG tankers.
TTF: Europe’s reference
The Title Transfer Facility is a virtual trading point on the Dutch gas grid, operated by Gasunie, with futures listed on ICE Endex. It displaced regional hubs like the UK’s NBP as Europe’s benchmark and became a household name in 2022, when the loss of Russian pipeline supply drove TTF above $90/MMBtu-equivalent while Henry Hub topped out near $10 — the widest transatlantic spread ever recorded, and a full-employment act for every LNG cargo trader on earth. TTF is quoted in euros per megawatt-hour; multiply by roughly 0.34 (at parity exchange rates) for a $/MMBtu feel, or just let your platform convert.
JKM: Asia’s spot marker
The Japan-Korea Marker, assessed by Platts, prices spot LNG cargoes delivered into Northeast Asia. It typically trades at a premium to both TTF and Henry Hub, reflecting shipping distance and Asia’s structural import dependence. Cold Asian winters send JKM vertical; those spikes pull US cargoes toward the Pacific and firm Henry Hub at the margin.
The arbitrage that keeps them honest
US LNG economics reduce to a simple inequality: a cargo makes sense when TTF or JKM exceeds Henry Hub plus liquefaction (roughly $2–3/MMBtu) plus shipping. When the spread is fat, terminals run at capacity and exporters mint money; when it compresses below that threshold — as it did in late 2020 when dozens of US cargoes were cancelled — feedgas demand sags and the domestic market softens. The three benchmarks never converge to one price, but the tankers keep them within shouting distance of the arbitrage bounds. For a Henry Hub trader, the practical rule is: you are no longer trading a purely domestic market, so check TTF and JKM every morning.
Tracking Henry Hub Prices in Practice
Where to get the numbers, from free to professional:
- CME Group publishes delayed NG futures quotes, settlements, volume and open interest on its Henry Hub futures page — sufficient for most retail analysis.
- EIA publishes the daily Henry Hub spot price, the weekly storage report, and production/demand estimates, all free.
- Price reporting agencies (Platts Gas Daily, Natural Gas Intelligence) assess physical prices at Henry Hub and dozens of regional hubs — this is where basis becomes visible, and what physical contracts index against.
- Any futures broker streams real-time NG, QG, and MNG quotes once you have an account.
One habit worth stealing from desk traders: check the front-month price, the winter-strip price, and the front-month basis at your nearest hub together. The combination tells you whether a move is weather noise, structural tightness, or a local pipeline story.
Henry Hub and Power Prices
Because gas-fired plants generate about 40% of US electricity and usually set the marginal price in wholesale power markets, Henry Hub is effectively an input cost for the entire grid. The linkage runs both directions: a gas rally raises power prices in gas-heavy markets like Texas and the Northeast within the hour, while extreme power demand — heat domes, deep freezes, or a calm week that idles wind farms — pulls physical gas into turbines and lifts the hub. Power traders quote “spark spreads” (electricity price minus fuel cost) to track generator margins; gas traders should at least glance at them, because a blown-out spark spread signals power-sector gas demand before it shows up in any weekly statistic.
Will Henry Hub Stay on Top?
Every few years someone predicts a rival benchmark. The case for Henry Hub’s continued dominance is straightforward: the physical infrastructure keeps deepening (more pipelines and LNG terminals on the Gulf Coast, not fewer), the futures liquidity is self-reinforcing, and growing US export volumes mean more global gas is priced off Henry Hub, not less. Several international LNG contracts now index directly to it.
The honest risks are longer-dated: a production plateau in the 2030s, policy-driven demand erosion, or LNG contract structures migrating toward destination benchmarks like JKM. None of these threatens the Hub’s role this decade. For traders, the planning assumption is simple — North American gas will be priced at Erath, Louisiana for as far out as any forward curve you can trade.
What Henry Hub Pricing Means for Your Trading
Boil it down to five working rules:
- Henry Hub is the anchor; every regional price is Hub plus basis. Know both components of any physical price you look at.
- The futures curve is the market’s storage math made visible — contango means comfort, backwardation means scarcity, and the flip between them is a signal.
- Weather rules the front of the curve; production economics rule the back.
- LNG spreads to TTF and JKM set the strength of the export bid under the market.
- The Thursday EIA report is the weekly reality check — trade around it deliberately.
From here, the natural next steps are the contract specifications that turn this benchmark into tradable instruments, and the pillar natural gas trading guide, which builds the full strategy picture — seasonality, storage, weather, risk — on the benchmark foundation you now have. Learn the anchor first; everything else in gas is quoted against it.