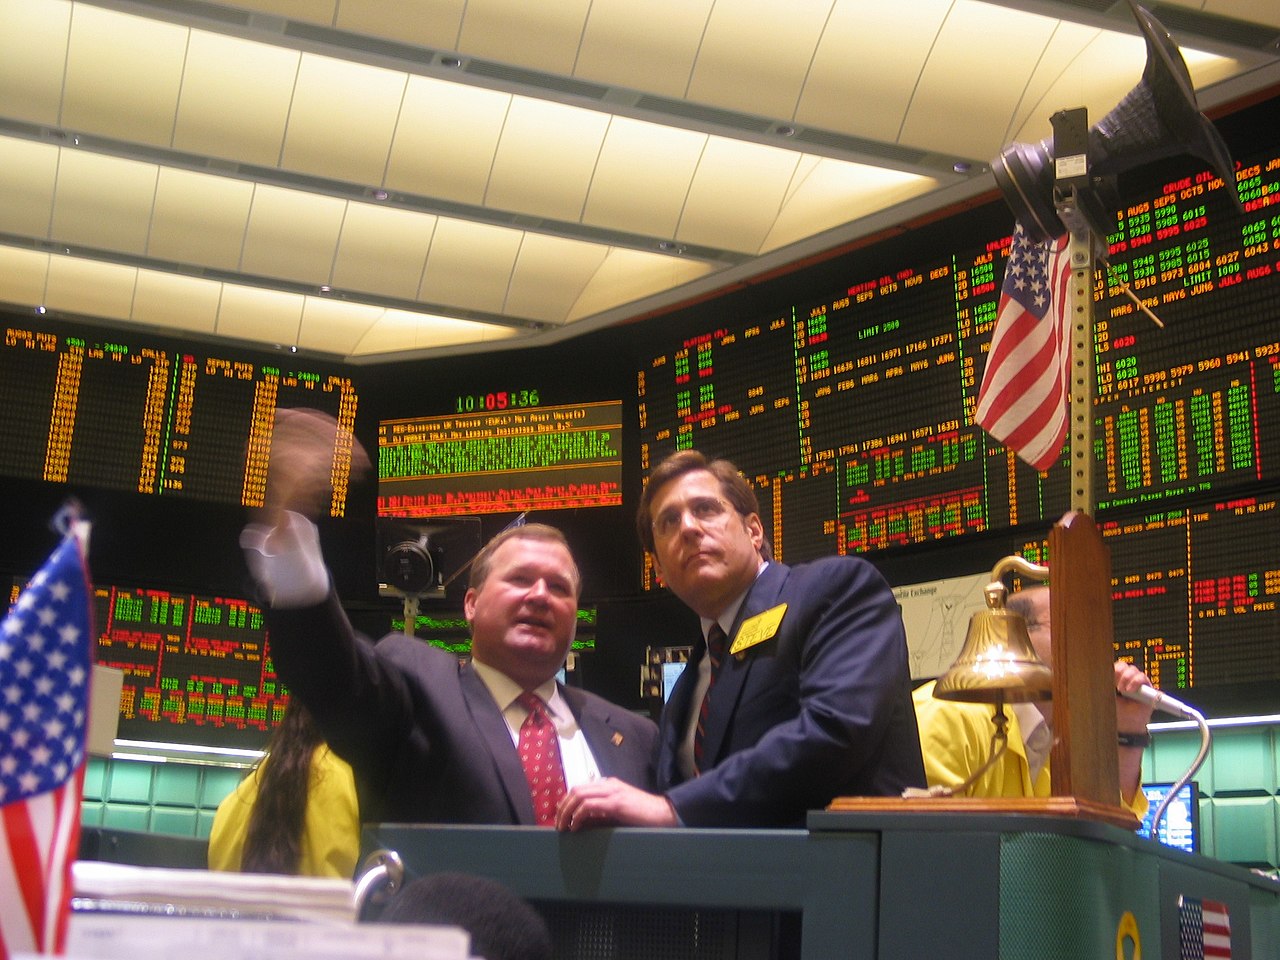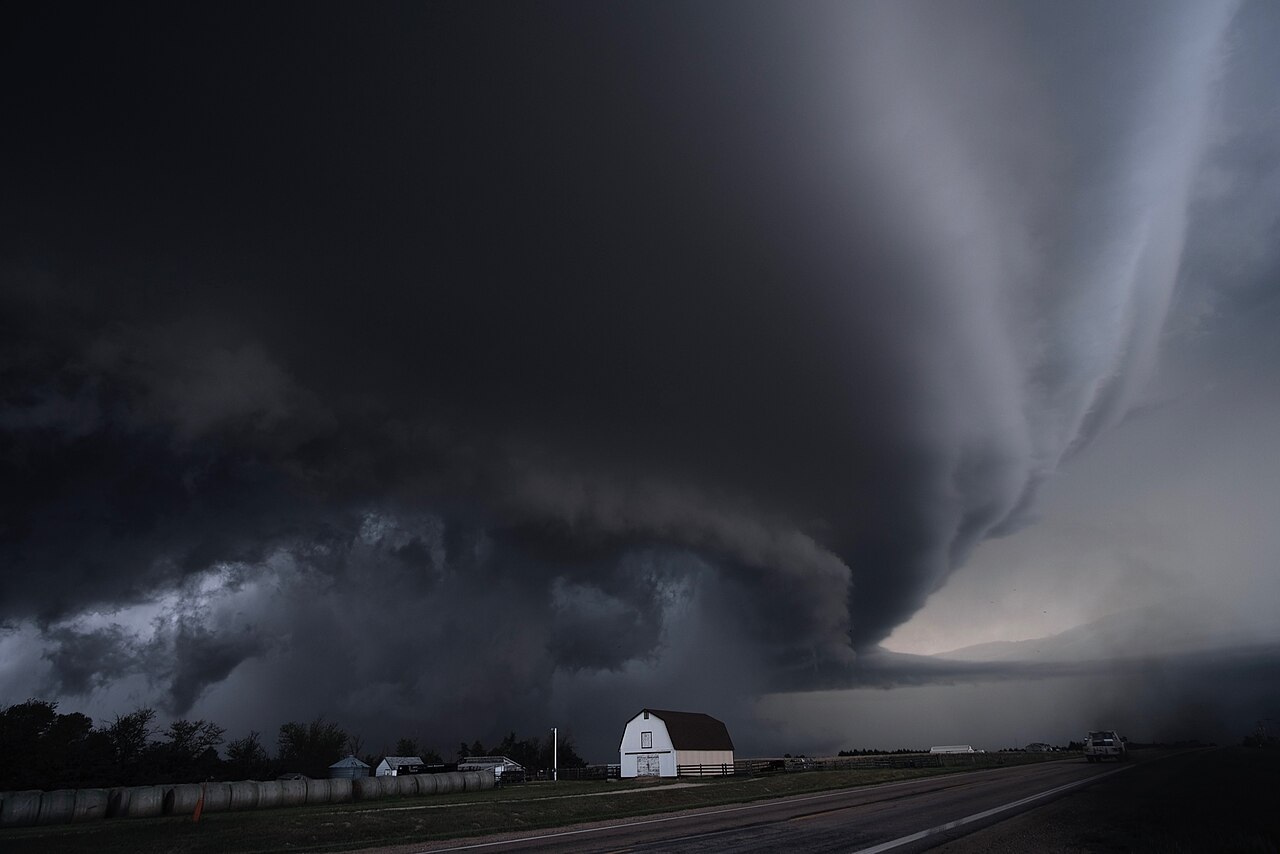
Natural gas futures are the most direct way to trade the most violent major commodity market in the world. Unlike options (which demand a view on implied volatility as well as price) or gas ETFs (which bleed value to roll costs), futures give you the price itself, with tight spreads and near-24-hour liquidity.
Learning how to trade natural gas futures means learning a market with its own weather-driven logic — storage cycles, heating degree days, and a weekly report that routinely moves prices harder than crude’s OPEC drama. This walkthrough covers the contracts, margin, execution, and the tactics specific to gas. For the broader market context — where the gas comes from, who burns it, and what sets the price — start with our complete guide to natural gas trading.
Natural Gas Futures Contract Specifications
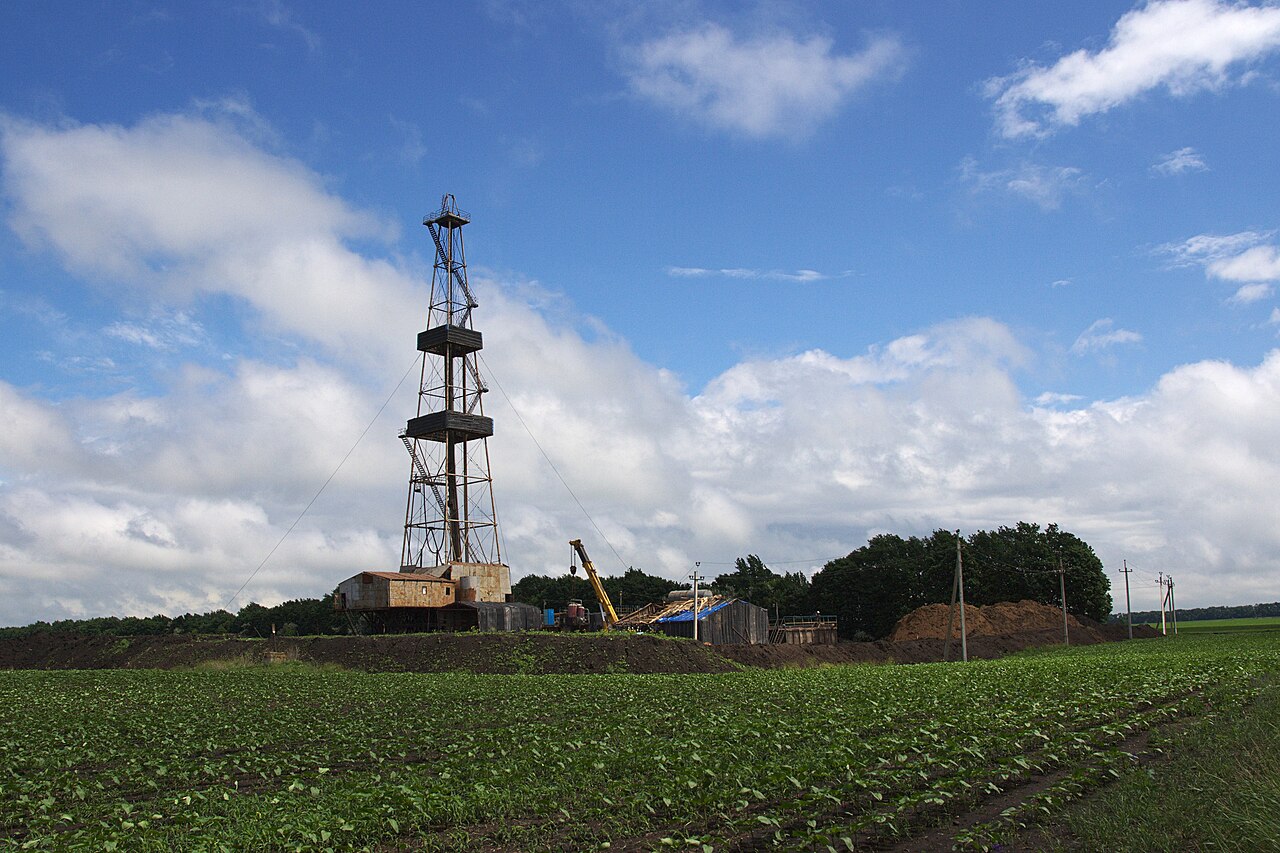
Before placing a single trade, you need the contract mechanics cold — and natural gas differs from crude oil futures in more ways than the commodity. If you want the deeper contract-by-contract treatment, our guide to natural gas futures contracts goes further; this is the working summary.
The Three Contract Sizes
| Contract | Symbol | Size | Tick size / value | 1-cent move | Approx. initial margin |
|---|---|---|---|---|---|
| Henry Hub Natural Gas | NG | 10,000 MMBtu | $0.001 = $10.00 | $100 | ~$4,000 |
| E-mini Natural Gas | QG | 2,500 MMBtu | $0.005 = $12.50 | $25 | ~$1,000 |
| Micro Henry Hub | MNG | 1,000 MMBtu | $0.001 = $1.00 | $10 | ~$400 |
Full NYMEX Natural Gas Contract (NG)
The benchmark is the NYMEX Henry Hub natural gas contract, symbol NG, listed by CME Group (the full specifications are worth reading once in the original). Each contract covers 10,000 MMBtu — million British thermal units — priced per MMBtu. The minimum tick is $0.001, worth $10; a one-cent move in the quoted price is $100 per contract. Trading runs nearly around the clock on Globex, Sunday evening through Friday afternoon, with a one-hour daily maintenance halt. Monthly contracts are listed years forward, all trading simultaneously.
Initial margin runs roughly $4,000 per contract in normal conditions, with maintenance margin a few hundred dollars below that. But “normal conditions” is doing a lot of work in that sentence: during volatility spikes — the run toward $10/MMBtu in late August 2022 being the modern benchmark — brokers demanded far more than exchange minimums, in some cases double or worse.
Example position: To control one NG contract at $3.50/MMBtu, you post roughly $4,000 in margin against a position worth $35,000 (10,000 MMBtu × $3.50). Each penny the price moves is $100 of profit or loss. Be wrong by just 5 cents and you lose $500. Be wrong by 40 cents — an ordinary bad week in this market — and you lose $4,000, essentially your entire margin deposit. This is why position sizing and stops are non-negotiable in gas.
E-mini Natural Gas Contract (QG)
The E-mini covers 2,500 MMBtu — one quarter of the full contract — with a minimum tick of $0.005 worth $12.50, so a one-cent move is $25. Initial margin is proportionally lower, roughly $1,000-$1,200. At $3.50/MMBtu an E-mini represents $8,750 of notional value, which suits traders working with $10,000-$15,000 accounts. Its liquidity is thinner than the full contract, so expect slightly wider spreads.
Micro Henry Hub Contract (MNG)
The Micro covers 1,000 MMBtu — one tenth of the full contract — with a $0.001 tick worth $1.00, so a one-cent move is $10. Initial margin is typically around $400-$500. At $3.50/MMBtu it represents $3,500 in notional value, which makes it tradable in accounts under $5,000 and useful for fine-grained position sizing even in larger ones.
Recommendation for beginners: start with MNG micros. They give you real skin in the game while keeping the cost of education survivable. Once you are consistently profitable at micro size, scale to the E-mini or the full contract — the market will still be there.
Understanding Margin in Natural Gas Futures
Margin works differently in futures than in stock trading, and misunderstanding it is how accounts die suddenly rather than gradually.
How Futures Margin Works
Futures are marked to market daily. Every day at the close, your unrealized profit or loss is settled in cash — credited or debited to your account immediately.
Example: You buy 1 NG contract at $3.45/MMBtu, posting roughly $4,000 initial margin. At the close, NG settles at $3.52.
- Price moved up 7 cents
- Your profit: 7 cents × $100 per cent = $700, credited to your account that evening
- Had price dropped to $3.40 instead, $500 would have been debited the same way
This daily settlement means your account balance genuinely fluctuates every session. You might start Monday with $10,000 and end Tuesday with $9,200 while “still in the trade.” Plenty of traders handle the analysis fine and fail at exactly this — watching real cash leave the account nightly.
Initial vs. Maintenance Margin
Initial margin is what you post to open a position. Maintenance margin is the minimum equity you must keep while holding it.
If your equity falls below the maintenance level, your broker issues a margin call: deposit enough to restore the account to the required level, or the position gets liquidated for you — usually at the worst possible moment, since forced selling clusters exactly when prices are moving hardest.
This is the practical argument for the 1-2% risk rule. Traders who size sensibly rarely meet a margin call; traders who run maximum leverage meet them right before the market turns.
Choosing Your Broker for Natural Gas Futures
Broker selection affects your transaction costs, execution quality, and how well supported you are when something breaks.
Key Broker Evaluation Criteria
Regulation: CFTC-regulated and NFA-registered, verified on the NFA’s BASIC database. Non-negotiable.
Commissions: Natural gas commissions typically range from about $0.50 to $3.00 per contract round trip, with micros at the low end. At a hundred trades a year the difference compounds — but execution quality matters more than saving fifty cents.
Platform stability: During violent sessions — storage report shocks, cold-snap repricings, the 2021 and 2022 winter squeezes — retail platforms have buckled under volume. Test with paper trading during a storage report release before you trust real money to it.
Margin flexibility: Some brokers offer margin offsets for recognized spread positions (long one month, short another). Others hike requirements aggressively in volatile periods. Know your broker’s policy before winter arrives, not after.
Customer support: Gas trades nearly 24 hours. Can you reach a human on the phone overnight, or only an email queue?
Educational resources: The better futures brokers run genuinely useful webinars on storage reports, seasonality, and contract mechanics.
Names worth comparing: Interactive Brokers (lowest costs, steepest learning curve), Charles Schwab’s thinkorswim (strong education and platform), NinjaTrader (popular with active futures traders, highly customizable), and TradeStation (powerful platform, higher costs). Match the broker to your style rather than chasing any single feature.
Trading Hours and Session Characteristics
Natural gas trades nearly 24 hours on CME Globex, but the hours are not created equal. Knowing when the market is liquid — and when it is thin and treacherous — matters as much as knowing where it is going.
The Trading Day Breakdown
Sunday evening open (5:00 PM CT / 6:00 PM ET): The week begins. Weekend weather-model runs and any supply news gap straight into the open — Sunday night gaps are a recurring hazard for positions held over the weekend.
US morning session (roughly 8:00 AM – 2:30 PM CT): The liquid window. Domestic data lands here, volume peaks, and spreads are tightest. The EIA storage report drops Thursday at 9:30 AM CT (10:30 AM ET) inside this window. Best hours for retail execution, full stop.
Afternoon into the halt (2:30 – 4:00 PM CT): Often choppy as desks square up. Globex pauses daily from 4:00 to 5:00 PM CT.
Overnight session: Thin. Spreads widen, and stop orders can get run in low-liquidity air pockets. Asian LNG headlines and European gas moves (TTF) can drag Henry Hub around overnight with little volume behind the move.
Friday close (4:00 PM CT): Positions held over the weekend face two days of weather-model changes with no ability to react. Weekend risk in gas is real risk.
Recommendation: Trade the US morning session until you are experienced. Overnight gas is a professional’s market, and not obviously a good one even for them.
Why This Market Demands Respect: A Short History
Natural gas has a habit of destroying people who treat it like a slightly different crude oil. Three episodes make the point.
Amaranth, 2006. Amaranth Advisors was a multi-strategy hedge fund running roughly $9 billion when its natural gas calendar spread positions — built by a trader who had been printing money for two years — moved against it. The fund lost about $6.6 billion in weeks and collapsed. The instrument that did it was the same seasonal spread retail traders read about in strategy articles.
Winter Storm Uri, February 2021. When Texas froze, physical spot prices at some mid-continent hubs printed in the hundreds of dollars per MMBtu while the Henry Hub futures contract moved comparatively little. Traders who assumed futures would capture the physical squeeze — or that regional exposure was “basically the same trade” — learned what basis risk means.
The 2022 spike. After Russia’s invasion of Ukraine turned US LNG into Europe’s marginal supply, front-month NG ran from under $4 to briefly above $9.30, touching the $10 area in late August 2022 — the highest prices since 2008. By the following spring it traded back near $2. Anyone position-sized for a $2.50 market who kept that size through the spike was carried out; anyone short without stops was carried out faster.
The common thread: leverage that feels comfortable in a quiet tape is lethal when gas decides to move. Size for the market’s violent version, not its calm one.
The Critical Role of the EIA Storage Report
Every Thursday at 10:30 AM ET, the US Energy Information Administration releases its Weekly Natural Gas Storage Report. This single number often creates the largest price move of the week.
What the Storage Report Tells You
- Net change in storage: how much gas was injected into or withdrawn from underground storage that week
- Regional breakdowns: East, Midwest, South Central, Mountain, Pacific
- Comparison to last year: is storage running ahead of or behind the prior year?
- Comparison to the 5-year average: the market’s main yardstick for “tight” versus “loose”
Example: The report shows a 90 Bcf injection. If consensus expected 95 Bcf, less gas went into storage than the market assumed — supply-demand is tighter than modeled, which is bullish. If consensus expected 75 Bcf, the build came in much larger — bearish. The price reaction keys off the surprise versus consensus, not the absolute number.
Storage Report Trading: The Honest Version
Here is the part most articles skip: most retail traders lose money trading EIA releases. The first seconds after 10:30 AM belong to algorithms that read and act on the number faster than a human can perceive it. If you have no edge in forecasting the number itself, buying or selling into the print is paying a toll, not taking a position.
The realistic retail approaches, in rough order of sanity:
Approach 1 — Trade the fade. The market frequently overreacts to the headline surprise in the first minutes, then mean-reverts once the regional detail is digested. Waiting 5-15 minutes and fading a clearly overdone move, with a tight stop, is a defined, repeatable setup.
Approach 2 — Trade the number, if you can actually forecast it. Some traders build genuine estimates from weather data, pipeline flow models, and prior-week patterns. If your estimate differs meaningfully from consensus, positioning before the release is a real trade with real edge — and real gap risk. Size accordingly.
Approach 3 — Stand aside. Flat through the number, trade the trend that emerges afterward. Unfashionable, and often the highest-expectancy choice of the three.
Example trade (Approach 2): Consensus is an 80 Bcf injection; your weather and flow work points to 70 Bcf. A smaller build is bullish, so you buy 2 MNG contracts at $3.50 ten minutes before the release, stop at $3.42. The number prints 68 Bcf — tighter even than your estimate. Price jumps to $3.56 and you sell into the pop at $3.55. Five cents on two micros at $10 per cent is $100. Some weeks the same process loses: consensus turns out right, you eat the stop for $160. The edge, if you have one, lives in the estimate — never in the execution.

How Weather Forecasts Move Prices
Weather is the dominant short-term driver of natural gas prices. Small forecast changes routinely move gas harder and faster than genuine fundamental shifts move crude.
Weather Services and Demand Estimates
Professional gas traders subscribe to specialized services — Commodity Weather Group and Atmospheric G2 (formerly WSI) are desk standards — for:
- 10-15 day temperature forecasts for the major heating and cooling demand centers
- HDD/CDD estimates: temperature forecasts converted into estimated gas demand
- Model comparisons: how the American and European weather models differ, and how each run shifted
- 30-day outlooks for longer positioning
HDD explained (Heating Degree Days): a measure of heating demand against a 65°F base. A day averaging 65°F scores zero; a day averaging 50°F scores 15 HDDs. A colder winter means higher cumulative HDDs, which means more gas burned. CDDs (cooling degree days) do the same job for summer air-conditioning demand, which now matters nearly as much given how much power generation runs on gas.
Trading forecast changes: The most powerful moves come when the forecast flips. A model run that adds a major cold spell ten days out can reprice the whole winter strip within hours — the market trades the expectation, not the thermometer. These moves happen before a single extra molecule is burned, and they reverse just as fast when the next model run walks the cold back. If you trade gas in winter, you are trading weather models whether you subscribe to them or not.
Seasonal Patterns and Calendar Spreads
Natural gas runs on a storage calendar: injection season from roughly April through October, withdrawal season from November through March. That cycle shapes the futures curve and creates the seasonal trades everyone eventually hears about — usually without the warning labels.
The Winter Premium
Winter delivery months carry a structural premium over summer months, because storage is the only bridge between steady production and weather-spiked demand. In late summer, with storage near its seasonal peak, prompt prices are often at their softest while January and February hold their premium. Traders express views on this cycle two ways: outright (buying winter-month contracts in late summer, betting the cold-risk premium expands) or as calendar spreads between injection-season and withdrawal-season months. Spreads are the professional’s tool — lower margin, defined relationship — but do not mistake lower margin for lower risk.
The Widowmaker
The March/April spread — the last month of withdrawal season against the first month of injection season — is nicknamed the widowmaker, and it earned the name. It is a leveraged bet on how winter ends, and when a late cold shot or a warm February shows up, the spread moves violently. This is the family of trade that destroyed Amaranth in 2006. If a $9 billion fund can be carried out by seasonal gas spreads, assume your retail account can be too. Trade seasonal spreads small, if at all, and only after you understand why the relationship exists.
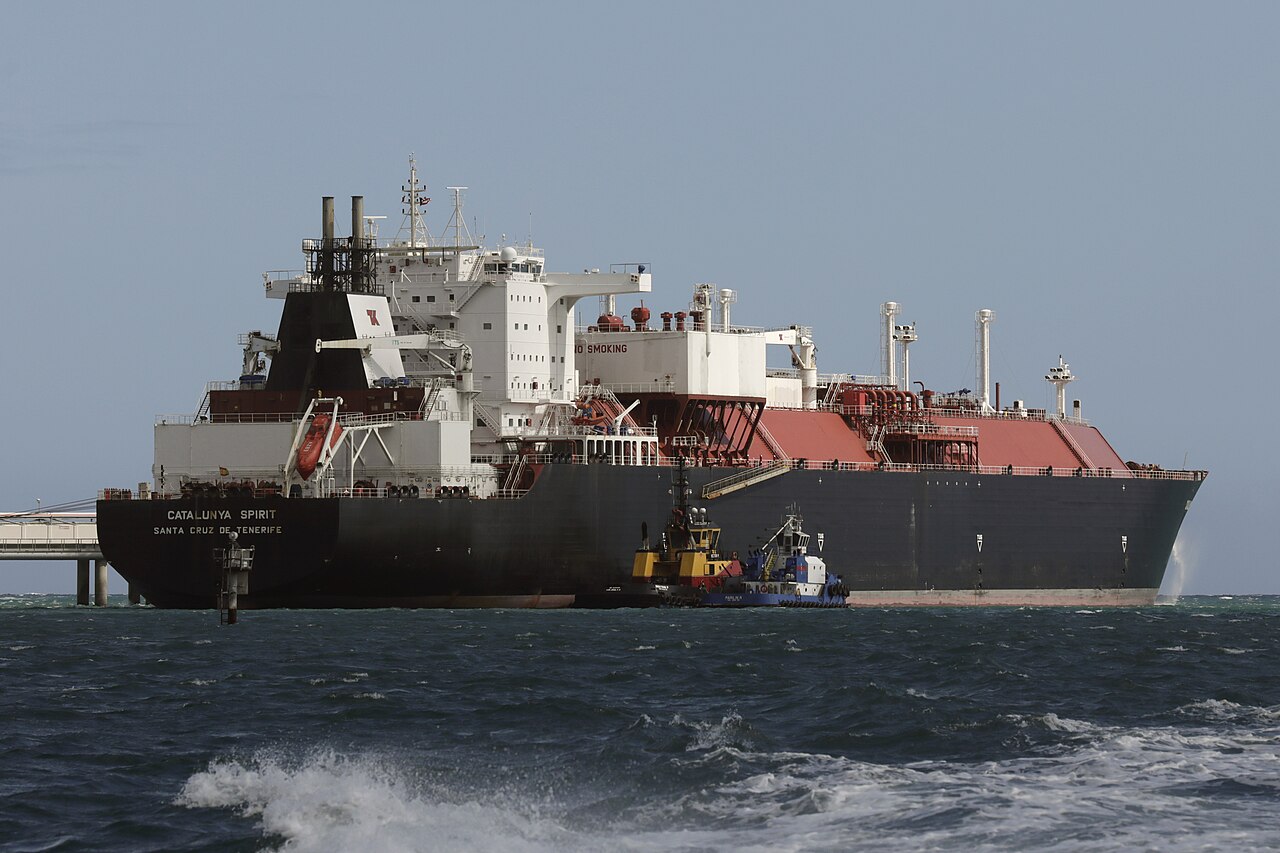
The modern caveat: LNG exports have rewired the old seasonal logic. US gas now clears against global demand year-round — a European supply crisis or a hot Asian summer supports prices in months that were historically soft. The seasonal tendencies still exist; they are simply weaker and less reliable than the backtest from the pre-LNG era suggests.
Summer Consolidation
From June through August, gas often settles into ranges. Volume declines, volatility compresses. Professionals adapt by:
- Range trading: defining support and resistance and trading the edges
- Breakout preparation: watching for the range break that positions into fall
- Spread trading: working calendar spreads as storage builds
- Trading less: many simply reduce activity and wait for winter’s opportunity set
Volatility-Adjusted Sizing Across Seasons
Winter volatility in natural gas runs roughly double summer’s. The professional response is counterintuitive: hold dollar risk constant, which means smaller positions in winter (wider stops, wilder swings) and larger positions in summer (tighter stops, calmer tape). Traders who keep the same contract count year-round are unknowingly doubling their risk every November.
Contract Expiration and Rolling
Every NG contract stops trading three business days before the first calendar day of its delivery month — the May contract stops trading in the last days of April, and so on. Positions held past that point go to physical delivery, executed ratably across the delivery month at Henry Hub in Louisiana.
Understanding Expiration
As a retail trader you have no business being anywhere near delivery of 10,000 MMBtu of physical gas — you have no pipeline capacity, no storage, and no counterparty. Your broker knows this, which is why most will forcibly liquidate retail positions in an expiring contract before the deadline, sometimes with a fee attached.
Action required: Close or roll expiring positions at least 5-10 trading days before the contract’s last trading day. Put the roll dates in your calendar at the start of every month; expiration surprises are entirely self-inflicted.
Rolling to the Next Contract Month
Rolling means closing your position in the expiring month and simultaneously opening the same position in the next month.
Example: You are long 1 June contract (NGM26) and expiration approaches. You sell the June and buy the July in one spread transaction. Most platforms offer the calendar spread as a single instrument, which executes both legs simultaneously and minimizes slippage.
The Roll Spread
The two months trade at different prices, and the difference is not noise. During injection season (April-October), nearby months typically trade below deferred months — contango — reflecting storage carry costs. During withdrawal season (November-March), the relationship often inverts into backwardation, with nearby months at a premium as storage is drawn down.
Trading implication: Rolling a long position in contango costs a little each time (selling the cheaper month, buying the dearer one); rolling in backwardation pays a little. Over months of holding, roll costs compound into a real drag — this is the same mechanism that makes gas ETFs chronically underperform spot. Plan rolls deliberately rather than treating them as admin.
Order Types for Natural Gas Futures Trading
Different order types suit different situations. Mastering them improves execution quality.
Market Orders
A market order buys or sells immediately at the best available price. Use it when speed matters more than price — locking in profits on a winning trade, or exiting fast when a thesis breaks.
Downside: You accept whatever the market offers. During high volatility the fill can be several cents worse than the quote you saw (slippage).
Limit Orders
A limit order buys at or below a specified price, or sells at or above one. It only executes if the market reaches your level.
Use case: Gas trades at $3.50 and you want in at $3.40. You rest a buy limit at $3.40 and wait.
Advantage: You get your price or better. Disadvantage: The market may never come to you, and the trade never happens.
Stop Orders (Stop Loss)
A stop order becomes a market order when price touches your stop level. This is the backbone of risk management.
Use case: Long from $3.45, you place a sell stop at $3.35 to cap the loss near 10 cents. If price trades down to $3.35, the stop fires and exits at market — $3.35 or, in a fast market, somewhat worse.
Critical caveat: Gaps blow through stops. If overnight news opens the market at $3.20, your $3.35 stop fills near $3.20, not $3.35. This is exactly why position sizing, not the stop alone, is the real risk control.
Stop-Limit Orders
A stop-limit places a limit order (instead of a market order) when the stop triggers.
Example: Sell stop-limit with stop $3.35, limit $3.32. If price hits $3.35, a sell limit at $3.32 goes live. If the market gaps straight through to $3.25, the order does not fill — you are still in the position, unprotected.
Recommendation: Most retail traders are better served by plain stops plus sane position sizing. Stop-limits have their place, but “my protective order didn’t fill” is a bad sentence to say out loud in this market.
Trailing Stops
A trailing stop ratchets up as price rises but never moves down.
Example: You buy at $3.45 with a 20-cent trail. Price runs to $3.60; your stop rises to $3.40. Price runs to $3.70; the stop sits at $3.50. When the market finally pulls back 20 cents, you exit with the bulk of the move banked.
Use case: Letting winners run in trending conditions — which, in gas, usually means a weather-driven repricing with follow-through.
Position Sizing for Natural Gas Volatility
Position sizing is the single biggest determinant of survival in this market. Get it wrong and good signals will not save you.
The 1-2% Rule, Adjusted for Season
Never risk more than 1-2% of your account on one trade — and in gas, the same rule produces different position sizes depending on the season, because stop distances must respect current volatility.
Winter sizing example: $20,000 account, 1.5% risk = $300 per trade. Winter swings demand a stop 30 cents from entry. On a micro (MNG), 30 cents is $300 of risk per contract. Size: one contract. That is not timid — it is arithmetic.
Summer sizing example: Same account, same $300 risk. Summer’s calmer tape supports a 15-cent stop, which is $150 per micro contract. Size: two contracts.
Same rule, same account, double the position — purely because volatility halved. Traders who size by gut feel run twice their intended risk all winter without noticing, and winter is exactly when the market punishes it.
Account Risk Limits
Beyond per-trade risk, set circuit breakers:
- Daily maximum: no more than 5% of the account at risk in one day, across all trades
- Weekly maximum: no more than 10% in a week
- If you hit the daily limit, you are done for the day. Not after one more trade. Done.
These limits exist because losing streaks degrade judgment precisely when good judgment matters most. The rule works because it is mechanical.
How to Trade Natural Gas Futures Around the Storage Report: A Worked Example
Theory into practice. Here is a full storage-report trade, with the reasoning at each step.
Pre-Report Setup (Wednesday Afternoon)
Step 1 — Get the consensus. Analyst surveys converge on a 95 Bcf injection for tomorrow’s report.
Step 2 — Build your own number. Your weather data shows the week was milder than the market narrative, and pipeline flow trackers point to strong production. You estimate a 110 Bcf injection — a much bigger build than consensus. Bigger build, looser market: bearish. Your plan is to be short into the number.
Step 3 — Define the risk before the trade. Account: $10,000. Risk budget at 1.6%: $160. On MNG micros, an 8-cent stop is $80 per contract, so the position is two contracts.
Report Day Execution (Thursday)
Step 4 — Enter. At 10:20 AM ET you sell 2 MNG at $3.45, with a buy stop at $3.53. If the report comes in near or below consensus, your thesis is wrong and the stop takes you out for a controlled $160 loss.
Step 5 — The release. At 10:30 the report prints a 112 Bcf injection — even looser than your estimate. Price drops fast: $3.40, then an overshoot to $3.33 as stops below the market trigger.
Step 6 — Exit into the flush. Your plan said take profits into the initial overreaction, not after it. You cover both contracts at $3.33. Twelve cents on two micros at $10 per cent: $240 profit against $160 risked — a 1.5:1 payoff on a trade where you had a genuine informational edge.
Post-Report Review (Thursday, 11:00 AM)
Step 7 — Journal it. Entry, exit, thesis, and what the market did after you left: price stabilized and retraced to $3.38 within the hour — the classic overreaction-and-fade pattern. Your exit into the flush was right. Also worth recording: had you been wrong, the loss was 1.6% of the account. The trade was survivable either way, which is the only kind of trade worth taking.
Risk Management Specific to Natural Gas Futures
Gas adds hazards beyond generic futures risk. Three deserve their own plans.
Gap Risk
The market halts daily from 4:00 to 5:00 PM CT and closes for the weekend. News does not. Weather models update, LNG facilities trip offline, wells freeze. When trading resumes, price gaps — and your stop fills at the reopened price, not your stop price.
Management: Cut position size on anything held overnight, and cut harder over weekends. If you would trade four micros intraday, hold two or three overnight. The discount is the price of sleeping.
Margin Spiral Risk
Volatility spikes trigger broker margin increases at exactly the moment your positions are losing. Underfunded accounts get liquidated into the panic — often right before the reversal.
Management: Keep a cash buffer well above maintenance margin at all times; a couple of thousand dollars per full contract is a reasonable floor. Excess margin is not idle money. It is optionality when the market goes insane.
Liquidity Risk During News Events
During major shocks, the bid-ask spread widens from a tick to several cents. Market orders during those minutes pay a brutal toll.
Management: Do not initiate new positions in the first minutes after a major surprise. Let spreads normalize — usually 10-15 minutes — before executing anything discretionary.
Common Natural Gas Futures Trading Mistakes
Mistake #1: Sizing off summer, trading into winter. Positions calibrated to a calm summer tape become double-risk positions when volatility doubles in November. Recalibrate every season.
Mistake #2: Holding through storage reports by accident. Even experienced traders get caught with positions at 10:29 on a Thursday. If holding through the number is not an explicit, sized decision, be flat.
Mistake #3: Ignoring basis. The futures settle on Henry Hub, but regional prices — Permian, Northeast, Gulf Coast — can decouple violently, as Uri proved. If your trade thesis involves a specific region, understand how Henry Hub pricing relates (and doesn’t) to that region’s reality.
Mistake #4: Over-trading shoulder season. April-May and September-October are choppy and directionless. More pros lose their year’s discipline there than in winter. Trade less when the market offers less.
Mistake #5: Ignoring weather. Weather is the dominant short-term driver of this market. Trading gas without at least free-tier forecast awareness is trading blind against people with better instruments.
Mistake #6: Confusing leverage tolerance with skill. Surviving three months of oversized positions is luck. The market eventually audits everyone; make sure your size passes the audit.
Building Your Natural Gas Trading Routine
Daily, before the US morning session:
- Check overnight news — LNG facility status, supply disruptions, European gas prices
- Review the latest weather model runs: any change to the 10-15 day outlook?
- Check the calendar: storage report day? Contract expiration approaching?
- Define today’s setup, or explicitly decide there isn’t one
During market hours:
- Execute the plan; adjust stops only in the direction of reduced risk
- Watch for news that breaks your thesis — and act on it rather than hoping
End of day:
- Record every trade: entry, exit, P&L, and the reason
- Review: did winners and losers behave as expected?
Weekly, Friday evening:
- Compute win rate, profit factor, largest winner and loser
- Re-check position sizing against current volatility
- Preview next week: storage report expectations, weather trends, expirations
Your Next Steps
Natural gas futures reward traders who specialize. The seasonal cycle, the weekly storage rhythm, the weather-model dependency — none of it transfers cleanly from other markets, and all of it is learnable.
Start on a simulator with micro contracts. Spend two or three months practicing storage-report weeks, seasonal positioning, and forecast-driven moves. Go live small, on micros, only when the simulator says you are consistently profitable — then build slowly.
Keep our natural gas trading guide at hand as the reference for everything upstream of execution — supply, demand, LNG, and the fundamentals that set the prices you are trading. This market pays specialists and punishes tourists. Decide which one you are going to be before your first contract, not after.