The oil futures curve is the full strip of WTI or Brent contract prices plotted by delivery month. Its slope — upward in contango, downward in backwardation — is a real-time gauge of physical tightness, storage economics, and market expectations. Traders read it through calendar spreads and trade it the same way, with far less flat-price risk than outright positions.
Most retail traders stare at one number: the front-month price on their chart. The professionals sitting across from them are watching thirty numbers at once, and the relationships between those numbers pay their salaries. This article covers how to pull the curve, how to decompose its moves, how to overlay positioning data, and how to put on a curve trade with defined math. It assumes you know the basics from our complete guide to crude oil trading; if the words contango and backwardation are new, start with our explainer on contango and backwardation and come back.
Getting the oil futures curve (free, daily)
You don’t need a Bloomberg terminal. CME Group publishes settlement prices for every listed WTI month on its Light Sweet Crude Oil page — futures are listed monthly out roughly a decade, though anything past three years trades by appointment. ICE does the same for Brent. TradingView and several brokers will draw the curve for you; a spreadsheet and ten minutes on settlement day works just as well, and forces you to actually look at the numbers.
Two practical notes. First, use settlements, not last-trade prices: deferred months can go hours without trading, and a stale last print will lie to you. Exchange settlement committees mark the whole strip daily precisely so the curve is coherent. Second, save your curves. A single day’s curve is a snapshot; the change in the curve over a week or a month is the actual signal. Desks keep years of curve history for a reason.
Anatomy of the curve: front, belly, back
The curve is not one market. It’s three loosely connected ones.
The front (months 1–3)
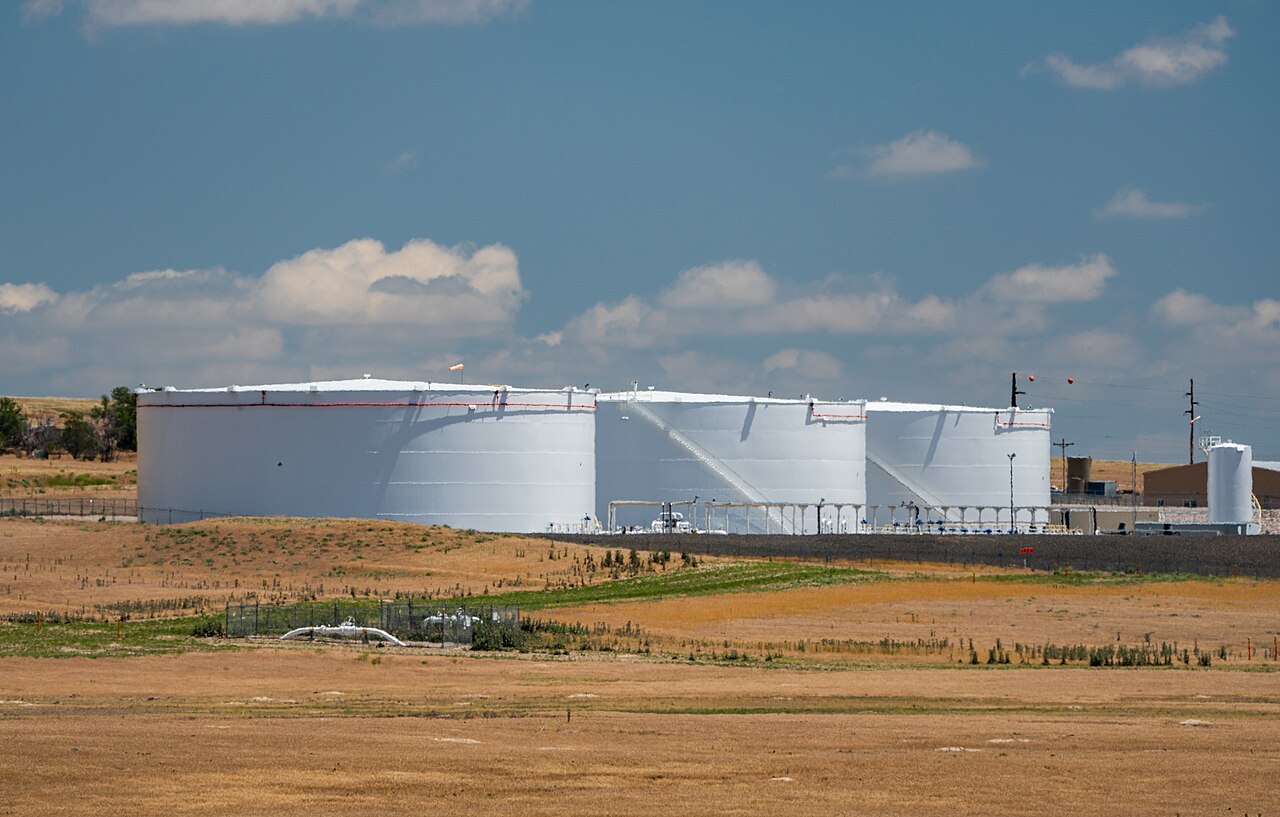
This is where the physical market lives. The front of the WTI curve answers to Cushing tank levels, pipeline flows, and refinery runs — it reprices violently on inventory surprises and supply disruptions. Liquidity is deepest here: the front month typically carries the bulk of daily volume, and the prompt spread (M1–M2) is the single most-watched number in the complex.
The belly (months 4–12)
The belly blends physical reality with expectation. Seasonal demand, OPEC policy over the coming quarters, and hedging flows dominate. Producers selling their forward program and refiners buying cover meet here.
The back (year 2 and beyond)
The back end is sticky. It’s anchored by the market’s rough sense of the long-run marginal cost of supply — historically somewhere around the level where U.S. shale economics clear — and it barely blinks at headlines that send the front $10 higher. December contracts dominate open interest out here (“the Decs”), because corporate hedge programs run on calendar years. When the back end does move, pay attention: the market is repricing something structural, not a news cycle.
Level, slope, curvature: decomposing a move
Any day’s move in the oil futures curve can be broken into three components, and each has a different message.
- Level: the whole strip shifts up or down together. Parallel moves are usually macro — dollar strength, risk appetite, a broad demand revision. The physical market is quiet; the financial market is repricing oil as an asset.
- Slope: the front moves against the back. A steepening backwardation (front up relative to deferred) is the signature of physical tightness — someone needs barrels now. A steepening contango is inventory congestion. Slope moves are supply-and-demand moves, and they’re covered in depth in our piece on oil supply and demand fundamentals.
- Curvature: the belly moves against both ends. Rarer and subtler — often hedging flow (a big producer program pressing the belly) or a calendar-specific event like a refinery turnaround season being repriced.
Run the decomposition mentally every day and you’ll stop asking “why is oil up?” and start asking the better question: which part of oil is up. A $2 rally driven entirely by the front two months is a different animal from a $2 rally spread evenly to 2028.
Spreads: the instrument you actually read (and trade)
Nobody trades “the curve.” They trade spreads — one month against another — and quote the curve through them:
- M1–M2 (the prompt spread): the twitchiest gauge of immediate physical conditions. On WTI, functionally a Cushing inventory dashboard.
- M1–M6: smooths the noise; the measure CME’s economists use to classify contango/backwardation regimes historically.
- Dec–Dec (e.g., Dec26–Dec27): the structural spread. Trades on annual balances, OPEC strategy, shale growth — not on this week’s stats.
Sign convention matters: energy calendar spreads are quoted front minus back, so +$1.20 means backwardation, −$0.60 means contango. A spread “rallying” means the market is tightening, regardless of what flat price does. It’s entirely normal to see flat price fall while the prompt spread rallies — that combination (softer price, tighter structure) usually reads as a market drawing inventory into weakness, and it has historically been a better bullish tell than either signal alone.
What each curve move usually means
| Observation | Most likely driver | Trading read |
|---|---|---|
| Whole strip up, spreads flat | Macro / dollar / positioning | Fade-able unless fundamentals confirm |
| Front up hard, back quiet | Physical shock, inventory draw | Tightness is real; respect the move |
| Front down, back quiet | Inventory build, glut forming | Contango pressure; check Cushing data |
| Prompt spread rallies, flat price falls | Drawing stocks into weak sentiment | Historically a bullish divergence |
| Back end reprices, front quiet | Structural: shale costs, OPEC strategy, demand outlook | Position for regime change, not a trade-of-the-week |
| Contango near full carry | Storage filling | Fragile front; blow-off risk (Apr 2020) |
Two caveats on using the table. First, drivers overlap — a macro selloff and an inventory build regularly arrive the same week, and the decomposition is only as good as your discipline in separating them. Second, the “trading read” column is a prior, not a system: it tells you which hypothesis to test against the inventory data and positioning reports, not what to buy. The traders who get hurt with term-structure analysis are the ones who skip that verification step and trade the pattern raw.
Overlaying positioning: the CoT report
The curve tells you what the market is pricing; the CFTC’s Commitments of Traders report tells you who is holding the bag. Every Friday afternoon the CFTC publishes positioning data as of the prior Tuesday, broken down by trader type — producers and merchants, swap dealers, managed money, and others.
The combination worth watching is managed-money net length against the shape of the curve. Steep backwardation plus record fund length is a crowded boat: everyone who believes the tightness story is already in, roll yield is the only marginal buyer left, and a modest fundamental disappointment can trigger an outsized spread collapse as funds liquidate. The reverse setup — deep contango, funds heavily short, spreads starting to firm — is where some of the best contrarian entries of the past decade lived, including the 2016 bottom.
Don’t over-engineer it. CoT data is three days stale on release, categories blur (a “producer” short may be a merchant’s hedge against stored barrels — itself a curve trade), and positioning extremes can extend for months. Use it as a crowding gauge, not a timing tool.
Trading the curve versus trading outright
Why trade spreads at all? Three reasons, and they compound.
- You isolate the variable you actually have a view on. If your work says Cushing draws 5 million barrels over the next two months, the prompt spread expresses that view directly. An outright long expresses it plus a macro bet, a dollar bet, and a headline-risk bet you never asked for.
- Margin efficiency. Exchanges margin calendar spreads at a fraction of outright requirements because the legs offset — a WTI calendar spread might tie up a tenth of the capital of a naked futures position, sometimes less for nearby months.
- Slower left tail. Spreads can still gap (April 2020 proved it), but day-to-day they move in cents while flat price moves in dollars. Sizing mistakes are more survivable. The order-entry mechanics — exchange-listed spread instruments versus legging manually — are covered in our guide to how to trade crude oil futures.
A worked calendar spread
Say it’s a soft market. September WTI trades $64.20, December trades $65.40: a $1.20 contango. Your inventory work says the glut is overstated — refinery runs are ramping and Cushing should draw hard into autumn. You buy the Sep/Dec spread (long September, short December) at −$1.20.
Six weeks later the draws have printed, the front has firmed, and the spread trades at −$0.30. You exit. You made $0.90 per barrel on 1,000 barrels per spread — each $0.01 of spread movement is $10, same as an outright — so $900 per spread before fees. Flat price over the same stretch went from $64.20 to $63.80: an outright long would have lost $400 per contract while your spread made $900. Right analysis, right instrument. Had you been wrong and the spread widened to −$1.80, you’d be down $600 — real risk, but bounded by the arbitrage logic of carry in a way naked length never is.
One step further out on the sophistication ladder sit calendar spread options (CSOs) — options that settle on the spread itself. They’re the cleanest way to buy convexity on a curve flip, and in 2020 and again in 2026 the people who owned cheap CSO wings were the ones smiling. Liquidity is thin outside the nearby months; treat them as a specialist tool.
The prompt spread as a Cushing dashboard
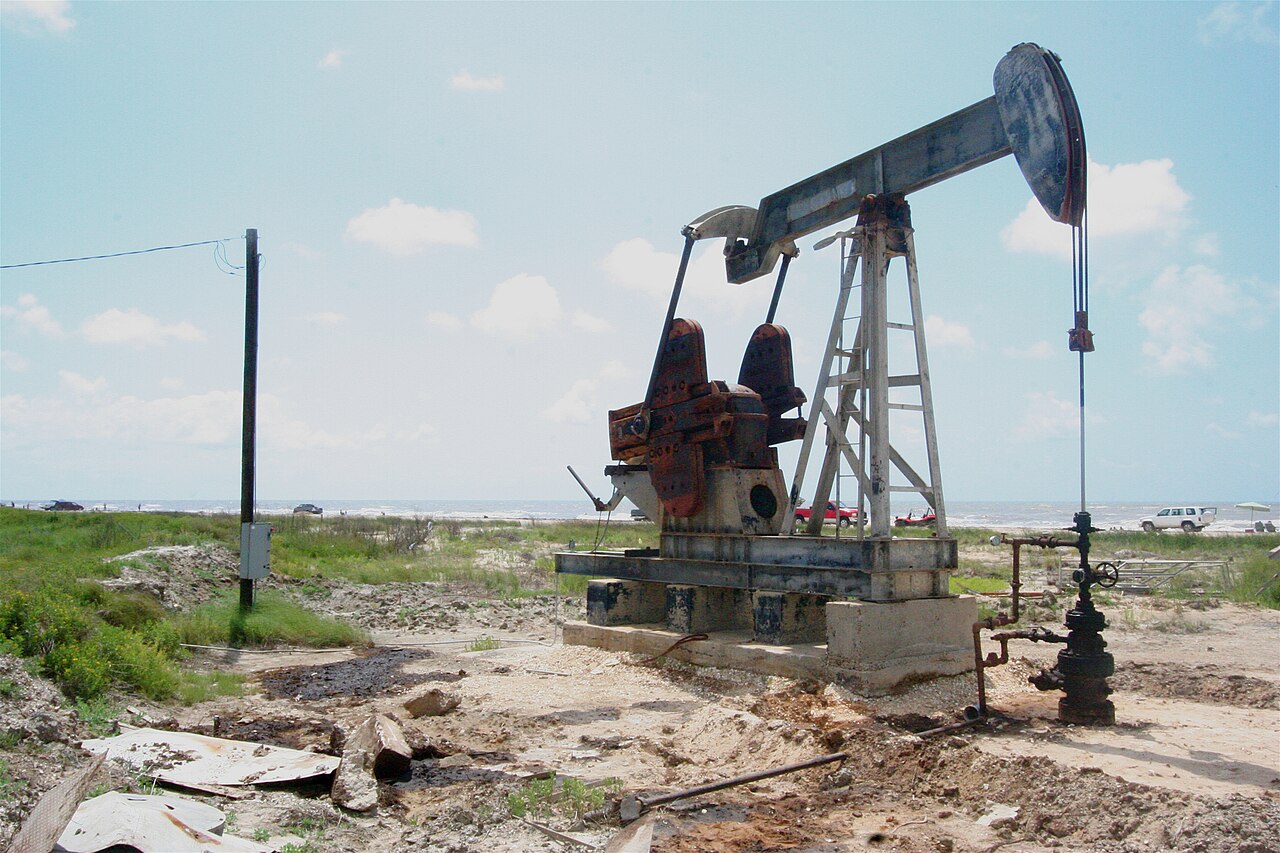
WTI is a physically delivered contract: every expiring month settles into actual barrels in tank at Cushing, Oklahoma. That delivery mechanism is what welds the front of the oil futures curve to physical reality. If the prompt spread pays more than a month of storage costs, commercials store and the spread tightens back; if barrels are scarce, shorts must buy back or source oil, and the spread rips. The front of the curve cannot drift far from tank economics for long — arbitrage drags it home.
That’s also why expiry weeks get strange. As a contract enters its final days, only participants who can make or take delivery remain, liquidity thins, and the spread between the dying month and the next one can move violently on flows that mean nothing for the broader market. April 20, 2020 — the day the May contract settled at −$37.63 — was an expiry-week event supercharged by full tanks: the June contract sat near +$20 the whole time. Rule of thumb: don’t read fundamental signals from a contract inside its last three or four trading days, and don’t trade one unless you understand the delivery process better than the person on the other side.
Between expiries, the prompt spread tracks Cushing stocks with impressive fidelity. Builds of a million barrels a week push it toward carry; sustained draws pull it into backwardation. When the EIA’s Wednesday data and the spread disagree — stocks building while the spread firms, say — one of them is early, and it’s usually the spread, because physical traders position ahead of the stats they can see coming through pipeline nominations.
Roll flow: the calendar’s artificial weather
Not every spread move is fundamental. The biggest systematic distortion is index roll flow. Commodity indices and the ETFs tracking them hold tens of thousands of front-month contracts and roll them on a published schedule — the largest concentrating in a window early each month, selling M1 and buying M2 over several consecutive sessions.
That flow is price-insensitive and perfectly predictable, and it leans on the prompt spread in the same direction every month: selling pressure on the front leg, buying on the second. In heavy-contango eras this “roll congestion” became a famous trade — front-running the index roll by selling the spread ahead of the window and covering into it. The edge has thinned as indices diversified their schedules and the arb got crowded, but the lesson stands: know the roll calendar before you interpret a spread move during roll week. A prompt spread softening during the index window is weather; the same move in a quiet week is climate.
Your own rolls deserve the same discipline. If you carry positions across months, roll early or late but not with the herd, use the exchange-listed spread order rather than legging (one fill, no leg risk), and remember the spread market is deepest mid-morning U.S. time when the physical desks are active.
Brent versus WTI: two curves, one story (usually)
Run the same analysis on both benchmarks and you get a bonus signal for free. Brent’s curve reflects the seaborne market — Atlantic Basin cargoes, freight, global demand — while WTI’s front end answers to one tank farm in Oklahoma. Most weeks they move together. The divergences are the information:
- WTI front weaker than Brent’s (WTI contango deepening while Brent holds) usually means a local mid-continent problem: Cushing filling, a pipeline outage upstream, refinery turnarounds in PADD 2. The 2011–2013 era was the extreme case, when land-locked shale barrels buried Cushing and WTI traded $20+ under Brent.
- Brent front stronger than WTI’s often flags a seaborne supply issue — West African disruptions, OPEC cuts hitting Atlantic cargo counts, or freight spikes — before it shows up in U.S. data.
- Both curves flipping together, as in March 2026, is the global signal: believe it.
The flat-price differential between the two benchmarks — the Brent–WTI spread, quoted on some platforms as “the Arb” — gets the headlines, but the relative structure (Brent M1–M2 versus WTI M1–M2) is frequently the earlier tell, because structure reprices on physical flows before outright differentials adjust.
Who trades each part of the curve (and why it matters to you)
Curve moves make more sense once you know whose flow dominates where. The front is physical players and short-term speculators: refiners covering prompt needs, merchants trading storage economics, funds expressing this quarter’s view. The belly is the hedging battleground: producers sell 6–18 months forward to lock drilling economics (shale hedge programs are a persistent, price-insensitive seller of the belly), while airlines and industrial consumers buy the same months from the other side. The back is corporate treasury territory — multi-year producer hedges, reserve-based lending requirements, the occasional pension-scale allocator.
This flow map explains persistent curve quirks. The belly often looks “cheap” relative to both ends because producer selling is structurally heavier than consumer buying — a flow imbalance, not a forecast. And when flat price spikes, producer hedging accelerates into the rally, which is one reason the back end lags: every dollar higher brings more forward selling out of the woodwork. Watching where on the curve the volume prints on a big day tells you whether you’re watching speculation (front), hedging (belly), or a genuine structural repricing (back).
Case study: reading the 2026 whipsaw in real time
The February–June 2026 Hormuz crisis was the most instructive curve event since 2020, because every phase told you something the flat price didn’t.
Phase 1: complacency (January–February)
WTI closed February 27 at $67.02 with the curve in mild contango. Inventories were adequate, OPEC spare capacity was the market’s security blanket, and the prompt spread was drifting near flat. Nothing in the curve predicted what came next — a reminder that the curve prices known balances, not geopolitics.
Phase 2: the flip (March)
After the February 28 strikes on Iran and the disruption of Hormuz traffic, the curve didn’t just rally — it rotated. Spot WTI ran toward $99 by early April and Brent traded past $120, but December 2026 moved a fraction of that. The market was pricing an acute, temporary shortage: exactly the shape theory assigns to a supply shock with intact long-run capacity. Traders who bought front spreads captured most of the crisis premium with a fraction of the margin; CME’s economists calculated that simply being long and rolling through the March backwardation added roughly five points of return over the spot move.
Phase 3: the tell (May–June)
Here’s the part worth framing: the front spreads peaked and started sliding before the ceasefire headlines. Tanker traffic data improved, the physical scramble eased, and the prompt spread gave it away while flat price was still holding $80+. By late June, Brent had fallen to the low $70s — a $17 drop in four sessions at one point — and the curve had flattened dramatically. Anyone using the spreads as their exit signal was out days before anyone using the news.
The general lesson: in a crisis, trade the shape, not the level. The shape told you the market never believed in $120 oil for 2027; the level screamed panic. The shape was right.
What the curve can’t tell you
Honesty section. The academic evidence that curve shape predicts flat price is mixed at best — term structure works better as a carry signal (what you earn for holding a position) than as a directional forecast. Three specific failure modes:
- Shocks come from outside the curve. February 2026 arrived out of contango. September 2019 (Abqaiq) arrived out of a sleepy market. No spread warned anyone.
- Backwardation is not a buy signal by itself. Late 2022 stayed backwardated for months while flat price fell $40. The curve correctly showed tightness easing at the margin the entire way down — but only if you watched the spreads’ direction, not their sign.
- The back end is a poor forecaster. Deferred prices chronically underestimated shale growth in the 2010s and have whipsawed on energy-transition assumptions since. Treat the back as a hedging market, not an oracle.
Common curve-reading mistakes
- Reading the deferred months as a forecast. December 2027 at $68 is not the market “predicting” $68 oil; it’s where hedging supply meets investment demand for that bucket. The curve has been a mediocre predictor of its own future in every era.
- Comparing spreads without adjusting for level. A $1 backwardation on $60 oil is structurally tighter than $1 on $100 oil. Percentage terms, or spread versus carry cost, travel better across regimes.
- Ignoring expiry mechanics. Treating a last-week-of-trading spread blowout as a fundamental signal is how people got run over in April 2020.
- Watching WTI alone. Half the false signals in the WTI front end are Cushing-local. Brent is the sanity check.
- Confusing roll flow with information. Index roll windows move spreads on schedule. Mark the calendar.
- Trading curvature without liquidity. Butterflies and deferred spreads look elegant in a spreadsheet and cost a fortune in slippage beyond the first year of the strip.
A weekly curve routine
Fifteen minutes, once a week, ideally after Wednesday’s EIA data:
- Pull WTI and Brent settlements; compute M1–M2, M1–M6, and Dec–Dec for each.
- Compare against last week and last month. Direction and rate of change first, level second.
- Check Cushing and total U.S. crude stocks from the EIA weekly report against the prompt spread — they should agree; investigate when they don’t.
- Skim Friday’s CoT for managed-money extremes.
- Ask the decomposition question: was this week a level move, a slope move, or a curvature move?
That routine sounds almost too simple, but it’s more than most retail participants ever do, and it front-runs a surprising share of the commentary you’ll read the following week.
The bottom line
The oil futures curve is the market’s balance sheet rendered as a line. The front is physics — tanks, pipes, refinery runs. The back is economics — marginal cost and hedge flow. Reading it means decomposing every move into level, slope, and curvature; trading it means using spreads to isolate the view you actually hold. Master the spreads and the flat price becomes context instead of noise. For the broader framework this sits inside — instruments, execution, risk — go back to our crude oil trading guide.